热带病与寄生虫学 ›› 2026, Vol. 24 ›› Issue (1): 36-40.doi: 10.20199/j.issn.1672-2302.2026.01.007
刘雅倩1( ), 龚磊2, 戴艳妮1, 耿浩翔3, 张力芹1, 孟梦1, 朱梦2, 朱标2, 吴家兵1,2()
收稿日期:2025-09-15
出版日期:2026-02-20
发布日期:2026-03-31
通信作者:
吴家兵,E-mail: 作者简介:刘雅倩,女,硕士在读,研究方向:公共卫生。E-mail: 基金资助:
LIU Yaqian1(), GONG Lei2, DAI Yanni1, GENG Haoxiang3, ZHANG Liqin1, MENG Meng1, ZHU Meng2, ZHU Biao2, WU Jiabing1,2()
Received:2025-09-15
Online:2026-02-20
Published:2026-03-31
Contact:
WU Jiabing, E-mail: 摘要:
目的 分析气象因素对安徽省流感发病的影响,为制定流感防控策略提供依据。方法 通过中国疾病预防控制信息系统收集2016―2019年安徽省流感病例资料,从安徽省气象局获取同期气象数据,运用分布滞后非线性模型(distributed lag non-linear model, DLNM),探讨气象因素与安徽省流感周发病数之间的暴露-滞后效应。结果 2016―2019年安徽省共报告流感病例152 284例,年均发病率为60.95/10万,发病率呈逐年上升趋势。周平均气温、周平均相对湿度和周总降水量与流感发病风险的暴露-反应曲线分别呈近似倒“U”型、“U”型及倒“U”型。周平均气温在10.40~17.20 ℃时发病风险升高,而在17.40~26.40 ℃时发病风险降低(P均<0.05);气温在P75(24.27 ℃)时,其滞后0~3周呈保护效应(RR=0.75,95%CI:0.58~0.98)。周平均相对湿度在55.50%~68.40%和83.20%~92.00%时发病风险升高(P均<0.05);相对湿度在P5(62.77%)和P95(88.34%)时,其滞后0~3周的累积效应显著升高(RR=1.48,95%CI:1.14~1.92;RR=1.51,95%CI:1.16~1.96)。周总降水量在242.20~1 254.60 mm时发病风险升高(P<0.05);降水量在P95(1 090.65 mm)时,其滞后0~3周的累积效应显著升高(RR=1.46,95%CI:1.02~2.10)。结论 较低的气温、较低的相对湿度、较高的相对湿度、较高的降水量均可能增加安徽省的流感发病风险,而较高的气温可能降低发病风险,且上述效应均具有一定的滞后持续性。将气象指标纳入流感预测模型,有助于提高预警的准确性。
中图分类号:
刘雅倩, 龚磊, 戴艳妮, 耿浩翔, 张力芹, 孟梦, 朱梦, 朱标, 吴家兵. 基于分布滞后非线性模型的安徽省流感发病与气象因素的关联性研究[J]. 热带病与寄生虫学, 2026, 24(1): 36-40.
LIU Yaqian, GONG Lei, DAI Yanni, GENG Haoxiang, ZHANG Liqin, MENG Meng, ZHU Meng, ZHU Biao, WU Jiabing. Association between influenza incidence and meteorological factors in Anhui Province based on a distributed lag non-linear model[J]. Journal of Tropical Diseases and Parasitology, 2026, 24(1): 36-40.
表1
2016—2019年安徽省流感的周发病数和气象因素的分布情况
| 变量 | 最低值 | M(Q1, Q3) | 最高值 |
|---|---|---|---|
| 周发病数(例) | 86 | 351(205,617) | 12 252 |
| 周平均气温(℃) | -1.92 | 17.26(8.59,24.27) | 32.14 |
| 周平均相对湿度(%) | 55.41 | 77.69(70.83,83.03) | 92.08 |
| 周平均风速(m/s) | 1.43 | 2.08(1.88,2.33) | 3.31 |
| 周总降水量(mm) | 0 | 229.03(71.65,552.98) | 3 509.63 |
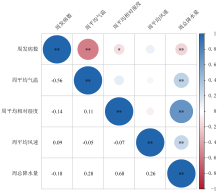
图1
2016―2019年安徽省流感周发病数和气象因素的相关性分析 注:*为P<0.05,**为P<0.01。

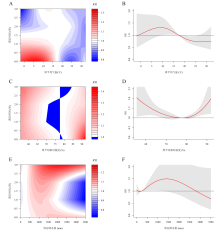
图2
安徽省气象因素对流感发病风险的滞后关联与暴露-反应关系 注:A、C、E分别为周平均气温、周平均相对湿度和周总降水量与流感发病风险的滞后关联等高线图,B、D、F分别为周平均气温、周平均相对湿度和周总降水量与流感发病风险的暴露-反应曲线(滞后0~3周的累积效应)。

表2
安徽省不同气象条件对流感发病风险的滞后及累积效应
| 气象因素 | RR(95%CI)值 | ||||
|---|---|---|---|---|---|
| 滞后0周 | 滞后1周 | 滞后2周 | 滞后3周 | 滞后0~3周 | |
| 周平均气温(℃) | |||||
| P5(2.48) | 1.32(0.91~1.92) | 1.19(0.90~1.56) | 1.00(0.75~1.32) | 0.78(0.54~1.13) | 1.23(0.75~2.03) |
| P25(8.59) | 1.30(0.96~1.75) | 1.11(0.90~1.37) | 0.99(0.80~1.23) | 0.93(0.69~1.24) | 1.32(0.96~1.82) |
| P75(24.27) | 0.86(0.66~1.12) | 0.93(0.78~1.10) | 0.97(0.82~1.15) | 0.98(0.76~1.26) | 0.75(0.58~0.98)* |
| P95(29.59) | 0.92(0.60~1.41) | 0.89(0.68~1.16) | 0.90(0.69~1.18) | 0.96(0.64~1.45) | 0.71(0.44~1.14) |
| 周平均相对湿度(%) | |||||
| P5(62.77) | 1.11(0.98~1.26) | 1.06(0.96~1.17) | 1.08(0.98~1.19) | 1.16(1.03~1.31)* | 1.48(1.14~1.92)* |
| P25(70.83) | 1.05(0.97~1.13) | 1.00(0.94~1.06) | 1.00(0.94~1.06) | 1.07(0.99~1.15) | 1.12(0.94~1.33) |
| P75(83.03) | 1.04(0.99~1.10) | 1.04(1.00~1.09) | 1.03(0.99~1.07) | 0.99(0.94~1.05) | 1.11(0.99~1.24) |
| P95(88.34) | 1.23(1.09~1.39)* | 1.11(1.01~1.22)* | 1.06(0.96~1.16) | 1.04(0.92~1.18) | 1.51(1.16~1.96)* |
| 周总降水量(mm) | |||||
| P5(0.05) | 1.02(0.90~1.16) | 0.95(0.87~1.05) | 0.98(0.89~1.07) | 1.09(0.96~1.23) | 1.03(0.80~1.34) |
| P25(71.65) | 1.01(0.94~1.08) | 0.97(0.92~1.02) | 0.98(0.93~1.03) | 1.04(0.98~1.11) | 1.00(0.87~1.15) |
| P75(552.98) | 1.02(0.96~1.09) | 1.04(0.99~1.10) | 1.06(1.00~1.12) | 1.07(1.00~1.14) | 1.20(1.03~1.41)* |
| P95(1 090.65) | 1.05(0.91~1.22) | 1.06(0.94~1.20) | 1.11(0.98~1.25) | 1.18(1.02~1.37)* | 1.46(1.02~2.10)* |
| [1] | 国家卫生健康委办公厅, 国家中医药管理局办公室. 流行性感冒诊疗方案(2020年版)[J]. 中国病毒病杂志, 2021, 11(1):1-5. |
| [2] | 王大燕, 舒跃龙. 流感大流行的历史及思考[J]. 中国科学:生命科学, 2018, 48(12):1247-1251. |
| [3] | World Health Organization. Influenza (seasonal)[EB/OL](2025-02-28)[2025-08-23]. https://www.who.int/news-room/fact-sheets/detail/influenza-(seasonal). |
| [4] |
Yang W, Cummings MJ, Bakamutumaho B, et al. Dynamics of influenza in tropical Africa: Temperature, humidity, and co-circulating (sub) types[J]. Influenza Other Respir Viruses, 2018, 12(4):446-456.
doi: 10.1111/irv.2018.12.issue-4 URL |
| [5] |
Guo QZ, Dong ZQ, Zeng WL, et al. The effects of meteorological factors on influenza among children in Guangzhou, China[J]. Influenza Other Respir Viruses, 2019, 13(2):166-175.
doi: 10.1111/irv.2019.13.issue-2 URL |
| [6] | 王金玉, 李盛, 冯亚莉,等. 气温对兰州市流行性感冒发病滞后效应[J]. 中国公共卫生, 2019, 35(9):1245-1249. |
| [7] |
Wang DN, Lei H, Wang DY, et al. Association between temperature and influenza activity across different regions of China during 2010-2017[J]. Viruses, 2023, 15(3):594.
doi: 10.3390/v15030594 URL |
| [8] | 王铭韩, 胡泽鑫, 冯录召,等. 新型冠状病毒感染疫情后我国季节性流感的流行趋势与防控建议[J]. 中华医学杂志, 2024, 104(8):559-565. |
| [9] |
Dormann CF, Elith J, Bacher S, et al. Collinearity: a review of methods to deal with it and a simulation study evaluating their performance[J]. Ecography, 2013, 36(1):27-46.
doi: 10.1111/ecog.2013.36.issue-1 URL |
| [10] |
Gasparrini A, Armstrong B, Kenward MG. Distributed lag non-linear models[J]. Stat Med, 2010, 29(21):2224-2234.
doi: 10.1002/sim.3940 pmid: 20812303 |
| [11] |
Wang JY, Zhang L, Lei RY, et al. Effects and interaction of meteorological parameters on influenza incidence during 2010-2019 in Lanzhou, China[J]. Front Public Health, 2022, 10:833710.
doi: 10.3389/fpubh.2022.833710 URL |
| [12] |
Thompson KA, Bennett AM. Persistence of influenza on surfaces[J]. J Hosp Infect, 2017, 95(2):194-199.
doi: S0195-6701(16)30574-6 pmid: 28139390 |
| [13] | 梁敏仪, 张敏怡, 范顺昌,等. 2016—2019年深圳市龙华区气温与14岁及以下人群流感发病的关联研究[J]. 环境与职业医学, 2023, 40(12):1431-1436. |
| [14] |
Eccles R. An explanation for the seasonality of acute upper respiratory tract viral infections[J]. Acta Otolaryngol, 2002, 122(2):183-191.
doi: 10.1080/00016480252814207 URL |
| [15] |
Lowen AC, Steel J. Roles of humidity and temperature in shaping influenza seasonality[J]. J Virol, 2014, 88(14):7692-7695.
doi: 10.1128/JVI.03544-13 pmid: 24789791 |
| [16] |
Liu ZD, Zhang J, Zhang Y, et al. Effects and interaction of meteorological factors on influenza: Based on the surveillance data in Shaoyang, China[J]. Environ Res, 2019, 172:326-332.
doi: S0013-9351(19)30068-4 pmid: 30825682 |
| [17] |
Lowen AC, Mubareka S, Steel J, et al. Influenza virus transmission is dependent on relative humidity and temperature[J]. PLoS Pathog, 2007, 3(10):1470-1476.
doi: 10.1371/journal.ppat.0030151 pmid: 17953482 |
| [18] | 徐澳, 刘光涛, 刘艳,等. 基于分布滞后非线性模型的环境因素与湖州市流感样病例发病的关联及滞后性研究[J]. 中华疾病控制杂志, 2023, 27(7):783-787. |
| [19] |
Li YB, Ye XF, Zhou J, et al. The association between the seasonality of pediatric pandemic influenza virus outbreak and ambient meteorological factors in Shanghai[J]. Environ Health, 2020, 19(1):71.
doi: 10.1186/s12940-020-00625-7 |
| [20] |
Kudo E, Song E, Yockey LJ, et al. Low ambient humidity impairs barrier function and innate resistance against influenza infection[J]. Proc Natl Acad Sci USA, 2019, 116(22):10905-10910.
doi: 10.1073/pnas.1902840116 pmid: 31085641 |
| [21] |
Yang W, Elankumaran S, Marr LC. Relationship between humidity and influenza A viability in droplets and implications for influenza’s seasonality[J]. PLoS One, 2012, 7(10):e46789.
doi: 10.1371/journal.pone.0046789 URL |
| [22] |
Paynter S. Humidity and respiratory virus transmission in tropical and temperate settings[J]. Epidemiol Infect, 2015, 143(6):1110-1118.
doi: 10.1017/S0950268814002702 pmid: 25307020 |
| [23] |
Qi L, Liu T, Gao Y, et al. Effect of meteorological factors on the activity of influenza in Chongqing, China, 2012-2019[J]. PLoS One, 2021, 16(2):e0246023.
doi: 10.1371/journal.pone.0246023 URL |
| [24] | Lau SY, Cheng W, Yu Z, et al. Independent association between meteorological factors, PM2.5, and seasonal influenza activity in Hangzhou, Zhejiang Province, China[J]. Influ Other Respir Viruses, 2021, 15(4):513-520. |
| [1] | 苏颖, 王斌冰, 柴瑜, 董燕, 王军平, 张宁, 宋菲扬. 2012—2024年安徽省急性乙型肝炎流行特征及疫苗接种情况分析[J]. 热带病与寄生虫学, 2025, 23(3): 144-148. |
| [2] | 方雨, 王荣, 方雪晖. 安徽省老年人肺结核防治核心信息知晓情况调查研究[J]. 热带病与寄生虫学, 2025, 23(2): 116-121. |
| [3] | 汪天平, 操治国. 安徽省实现消除血吸虫病的机遇、挑战与思考[J]. 热带病与寄生虫学, 2025, 23(1): 1-6. |
| [4] | 张进, 娄秋月, 戴色莺, 吴建军. 2012—2023年安徽省丙型病毒性肝炎流行特征分析[J]. 热带病与寄生虫学, 2025, 23(1): 34-39. |
| [5] | 许月野, 许薇, 杨月阳, 张安胜, 杨志伟, 王广辉, 操治国, 赵金红. 钉螺体内吸虫尾蚴的形态和分子特征鉴定[J]. 热带病与寄生虫学, 2025, 23(1): 44-48. |
| [6] | 葛盈露, 杨灵康, 刘以诺, 马婉婉, 王鹏, 孙永, 史永林. 2021—2023年安徽省手足口病柯萨奇病毒A组16型分子分型研究[J]. 热带病与寄生虫学, 2024, 22(4): 233-238. |
| [7] | 柳坤鹏, 朱启星. 基于分布滞后非线性模型分析巢湖市发热伴血小板减少综合征与气象因素的关系[J]. 热带病与寄生虫学, 2024, 22(3): 177-182. |
| [8] | 王阿鑫, 肖永康, 龚磊, 吴家兵. 2018—2022年安徽省其他感染性腹泻突发公共卫生事件流行特征分析[J]. 热带病与寄生虫学, 2024, 22(1): 7-11. |
| [9] | 冯明子, 傅荔艳, 葛盈露, 马婉婉, 王鹏, 孙永, 史永林. 2016—2020年安徽省手足口病相关柯萨奇病毒A组16型分子分型研究[J]. 热带病与寄生虫学, 2023, 21(4): 199-203. |
| [10] | 邓舒, 滕雪娇, 赵玉秋, 吴家兵. 2018—2022年安徽省突发公共卫生事件流行特征分析[J]. 热带病与寄生虫学, 2023, 21(3): 130-134,140. |
| [11] | 朱海, 孙成松, 汪奇志, 呼明闯, 章乐生, 赵蕾, 张世清. 安徽省部分地区淡水鱼华支睾吸虫感染状况调查分析[J]. 热带病与寄生虫学, 2022, 20(6): 325-329. |
| [12] | 张义华, 朱童娜, 周马云, 叶梦, 李承宝, 汪道发, 蔡亦红. 2015—2020年铜陵市流行性感冒监测结果分析[J]. 热带病与寄生虫学, 2022, 20(5): 253-256,273. |
| [13] | 代波, 汪天平, 许晓娟, 何家昶, 汪昊, 高风华, 丁宋军, 刘婷, 张世清. 2020年洪涝灾害后安徽省钉螺扩散情况调查[J]. 热带病与寄生虫学, 2022, 20(4): 191-196. |
| [14] | 秦淑国, 许元元, 赵萍萍, 李慧慧, 李振鹏. 全自动快速微生物质谱检测系统在流感嗜血杆菌快速鉴定中的价值分析[J]. 热带病与寄生虫学, 2022, 20(2): 94-95,102. |
| [15] | 杨静, 陈涛. 《人感染动物源性流感预防控制技术指南(试行) 》浅析:动物源性流感与流感大流行[J]. 热带病与寄生虫学, 2021, 19(6): 301-303,311. |
| 阅读次数 | ||||||
|
全文 |
|
|||||
|
摘要 |
|
|||||