热带病与寄生虫学 ›› 2026, Vol. 24 ›› Issue (2): 91-95.

• 结核病防控专题 • 上一篇    下一篇

EMD-SARIMA模型在新疆生产建设兵团肺结核发病预测中的应用

赵永年,王正业,王童敏   

  1. 新疆生产建设兵团疾病预防控制中心,新疆乌鲁木齐830023
  • 收稿日期:2025-11-05 出版日期:2026-04-20 发布日期:2026-05-29
  • 通信作者: 王童敏,E-mail: wtm1123@163.com
  • 作者简介:赵永年,男,本科,副主任医师,研究方向:肺结核防治与监测。E-mail: 274197584@qq.com
  • 基金资助:
    新疆生产建设兵团科研计划项目(BTCDCKY202202);福建医科大学启航基金项目(2024QH1279)

Application of EMD-SARIMA model in predicting pulmonary tuberculosis incidence in the Xinjiang Production and Construction Corps

ZHAO Yongnian, WANG Zhengye, WANG Tongmin   

  1. Center for Disease Control and Prevention of the Xinjiang Production and Construction Corps,
    Urumqi 830023, Xinjiang Production and Construction Corps, China
  • Received:2025-11-05 Online:2026-04-20 Published:2026-05-29

摘要:

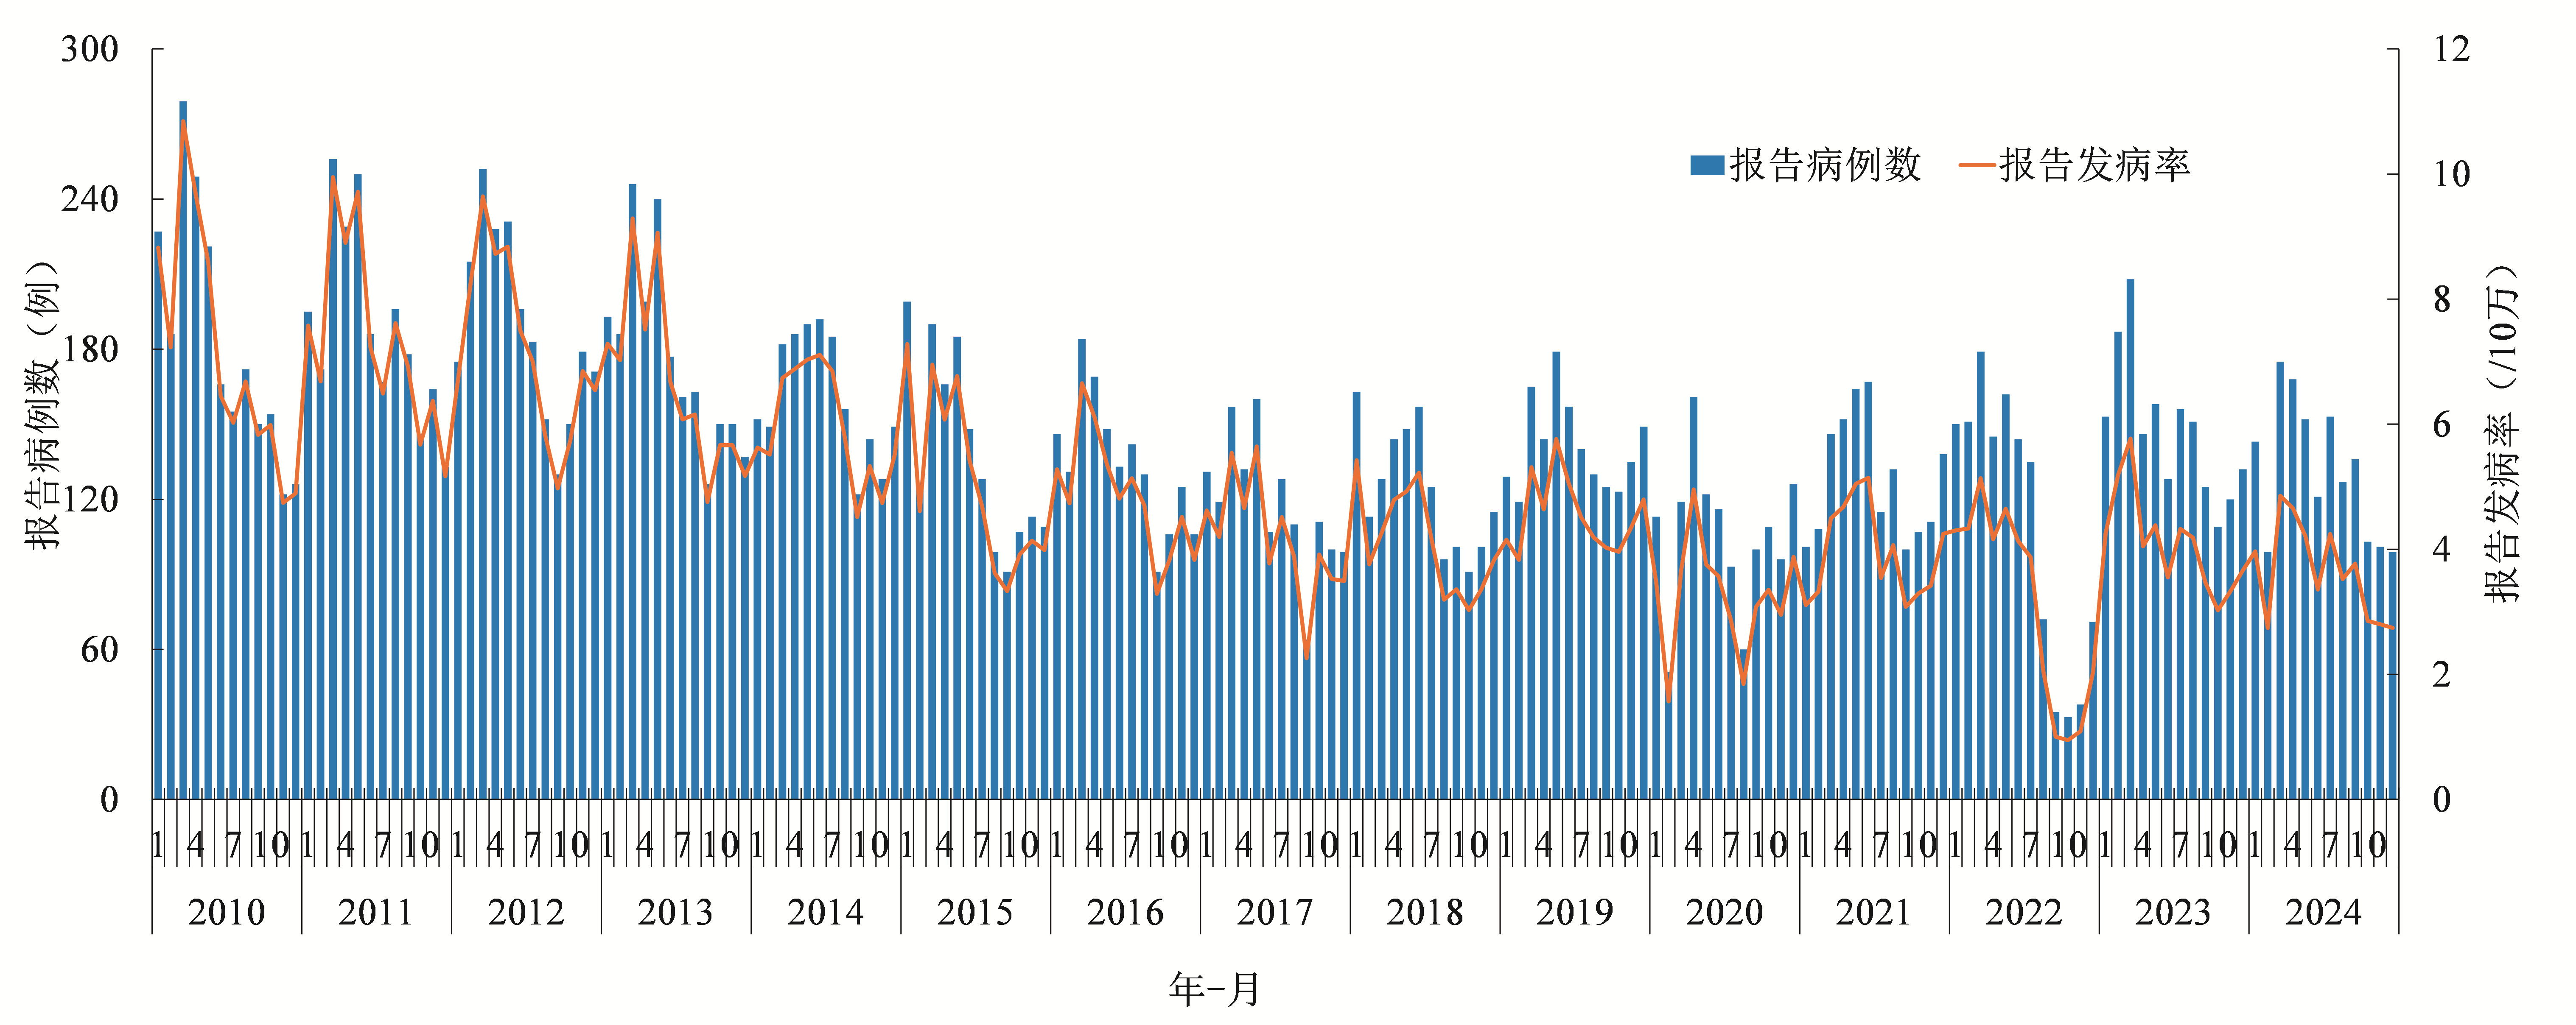
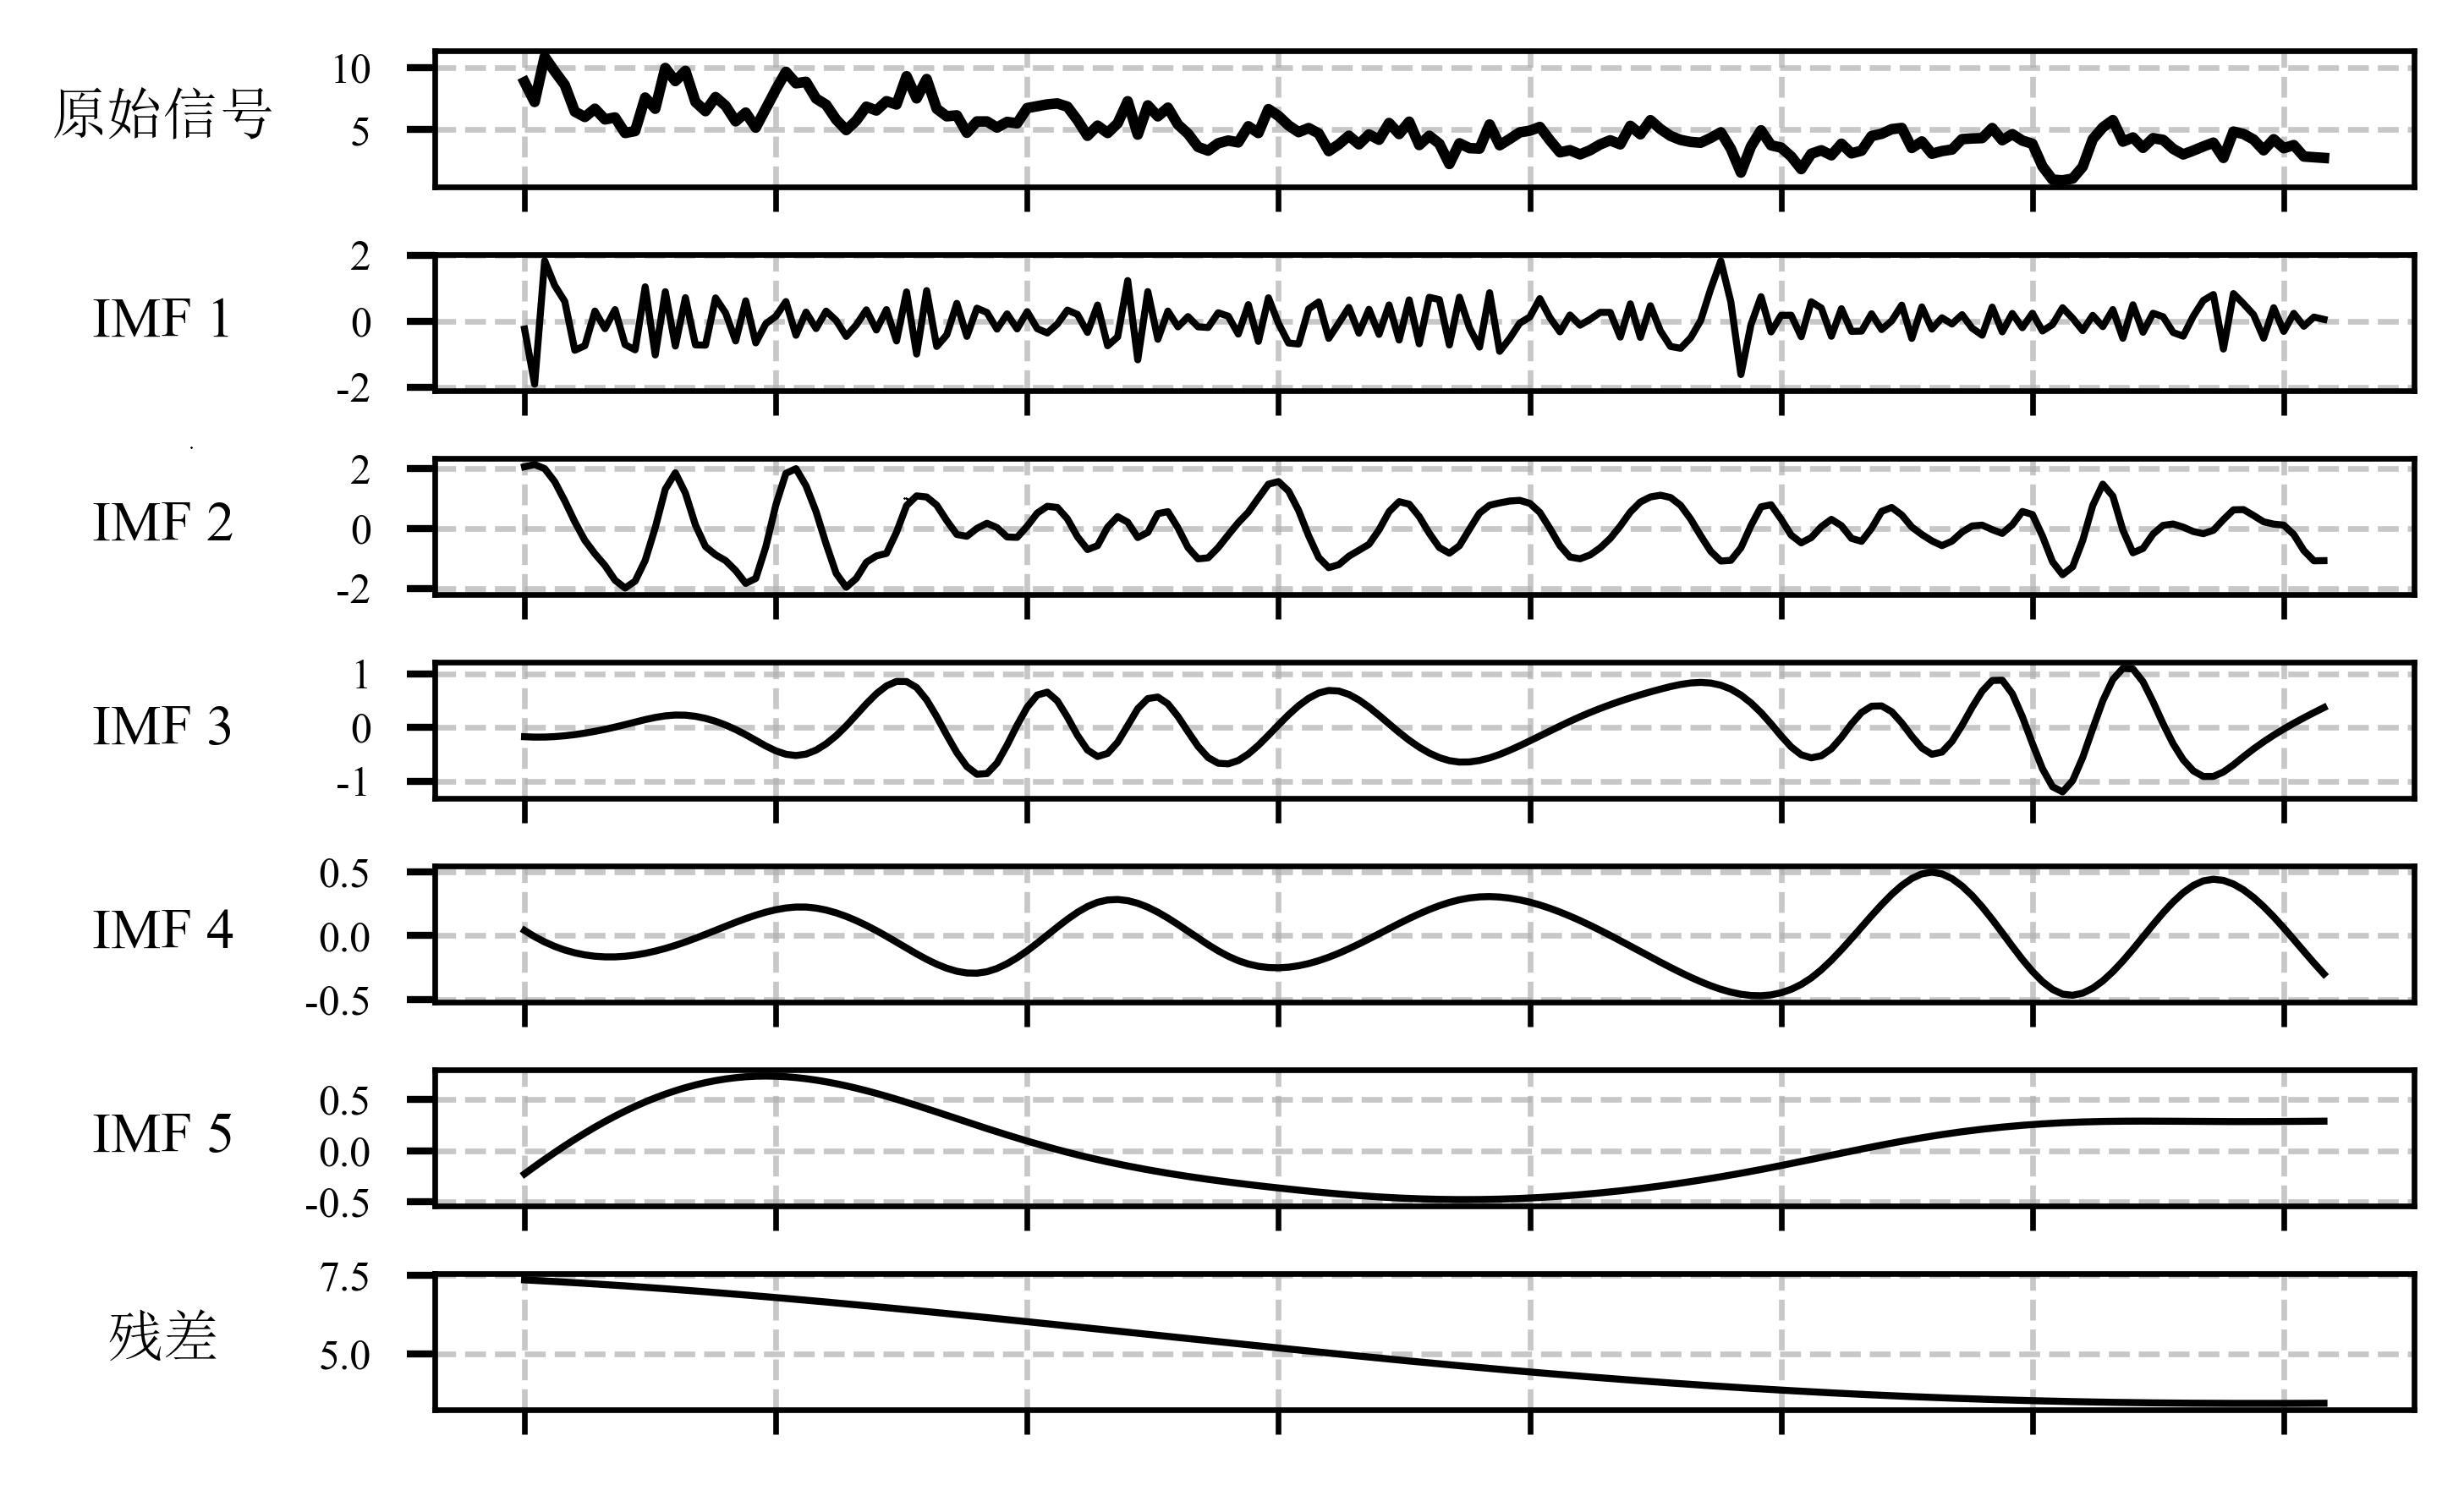
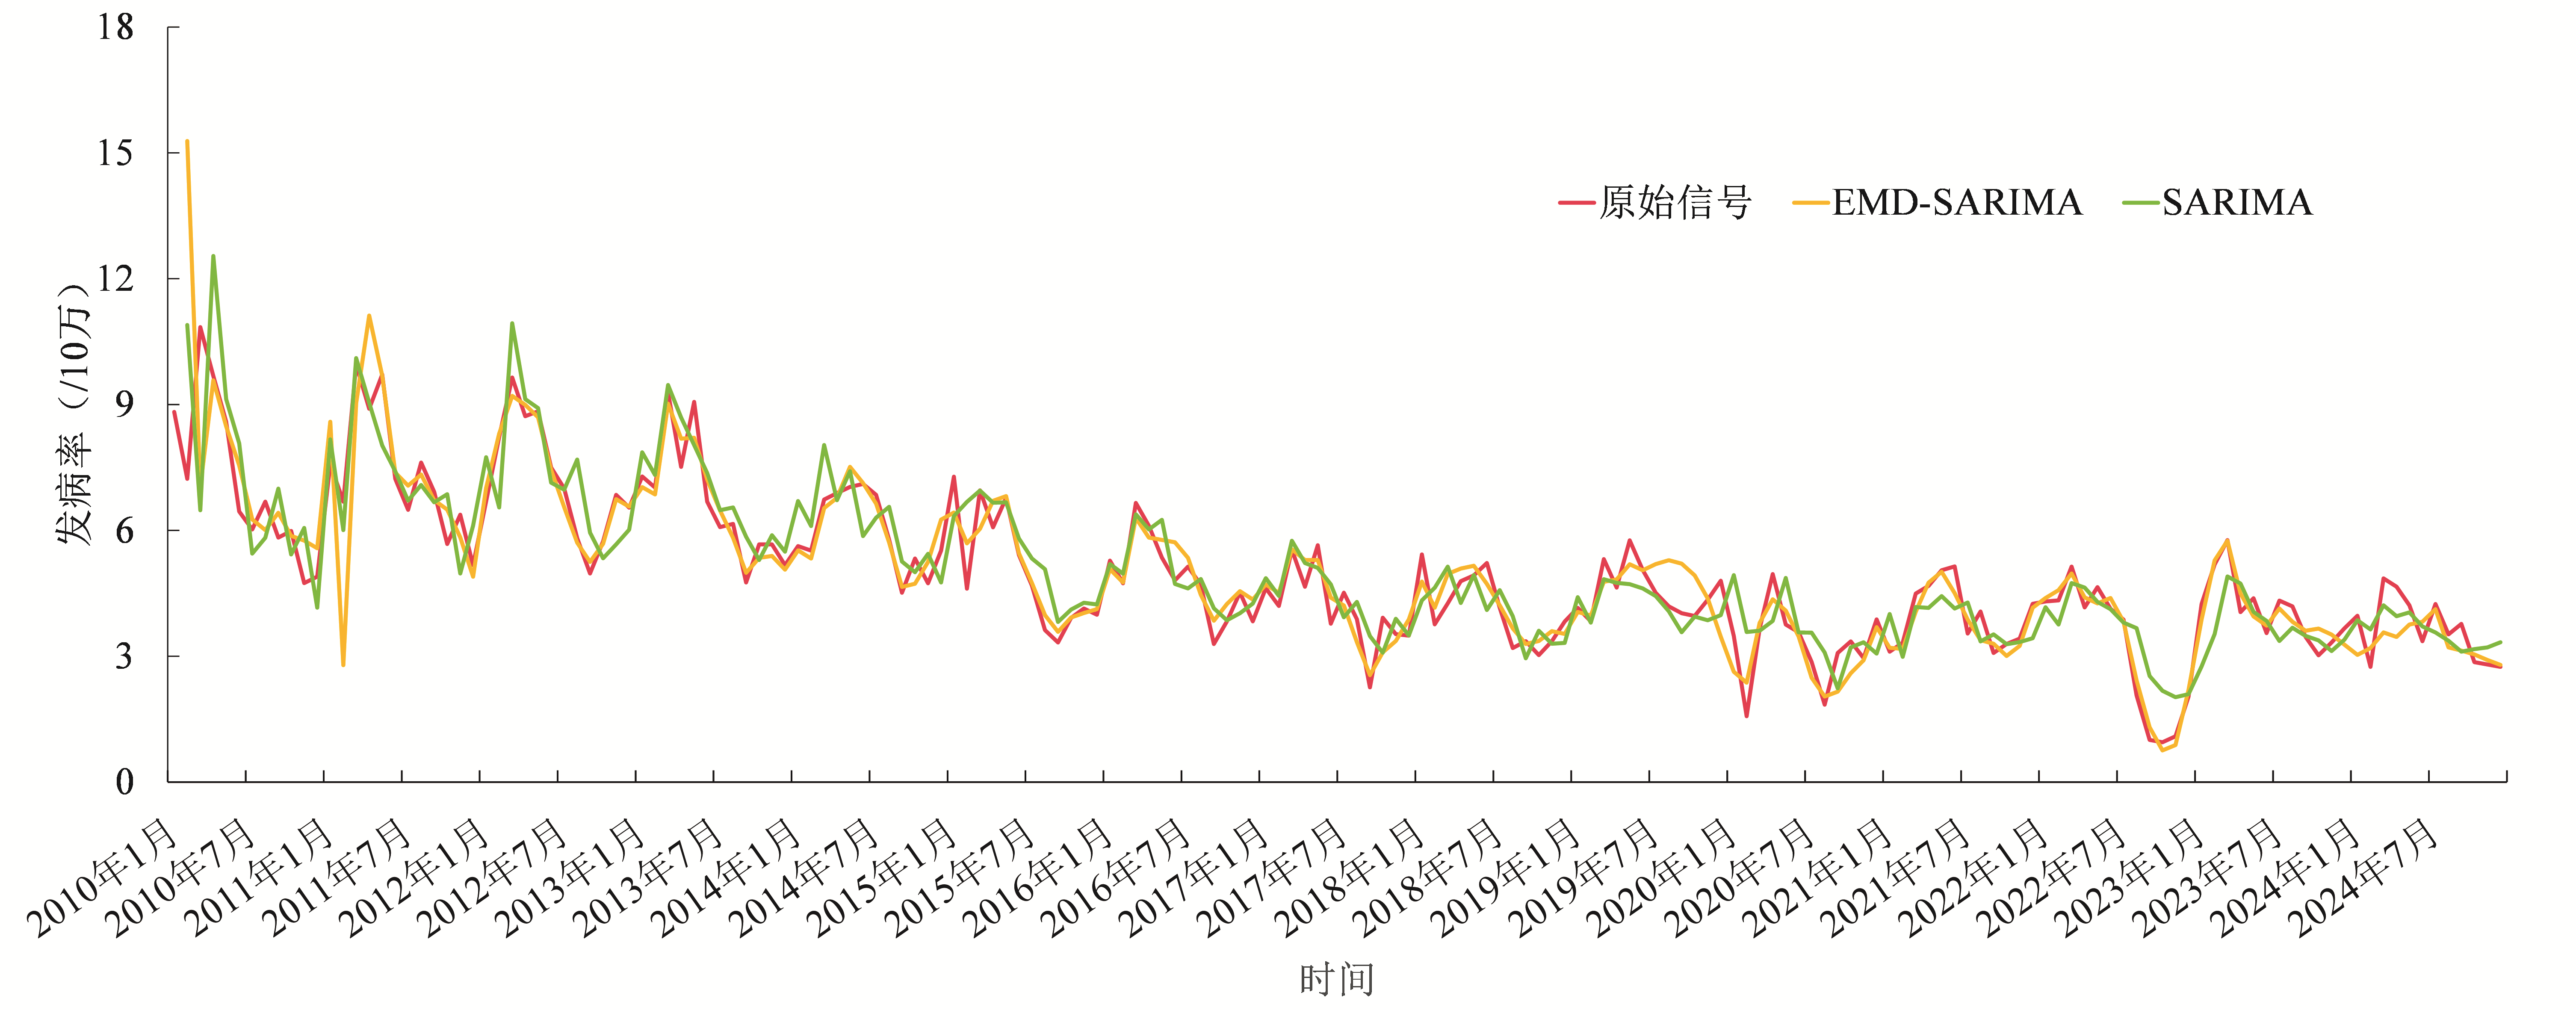
摘要:目的 了解经验模态分解-季节性差分自回归移动平均(empirical mode decomposition-seasonal autoregressive integrated moving average, EMD-SARIMA)模型预测新疆生产建设兵团肺结核发病趋势的效果。方法 获取并分析新疆生产建设兵团2010年1月至2024年12月的肺结核月报告发病数据。将2010—2023年的数据作为训练集,用于构建EMD-SARIMA模型;2024年的数据作为测试集,用于评估模型的预测性能,并比较EMD-SARIMA和单一SARIMA模型的预测性能。结果 2010—2024年,新疆生产建设兵团累计报告肺结核26 143例,年均报告发病率为58.42/10万,2011年报告发病率最高(88.30/10万),2022年最低(38.19/10万),总体呈下降趋势。原始信号被分解为5个固有模态函数分量(intrinsic mode function, IMF)及1个趋势项,根据最小Akaike信息准则为各分量确定了最优的SARIMA模型,且所有模型的残差均通过了白噪声检验(P均>0.05)。EMD-SARIMA模型的最终预测结果通过对各分量预测值求和得到。EMD-SARIMA模型的预测误差较低,其MSE、MAE、RMSE和MAPE值均低于单一SARIMA模型(0.283 vs. 0.745、0.473 vs. 0.775、0.532 vs. 0.863和13.587% vs. 21.115%)。结论 与单一SARIMA模型相比,EMD-SARIMA模型能更准确地预测新疆生产建设兵团肺结核发病趋势,具有更好的应用价值。

关键词: 肺结核, 经验模态分解, SARIMA模型, 预测

Abstract:

Abstract: Objective  To understand the effectiveness of empirical mode decomposition-seasonal autoregressive integrated moving average (EMD-SARIMA) model in predicting pulmonary tuberculosis (TB) incidence trend in the Xinjiang Production and Construction Corps. Methods  Monthly reported TB incidence data in the Xinjiang Production and Construction Corps were retrieved and analyzed from January 2010 to December 2024. Data from 2010 to 2023 were included in the training set to establish EMD-SARIMA model, and those from 2024 were used in the validation set to evaluate the predictive performance of the models. Finally, the forecasting performance was compared with that of the single SARIMA model. Results  From 2010 to 2024, a total of 26 143 TB cases were reported, with an average annual incidence rate of 58.42 per 100 000 population. The incidence peaked in 2011 (88.30 per 100 000 population) and was the lowest in 2022 (38.19 per 100 000 population), showing an overall downward trend. The original signal was able to be decomposed into five intrinsic mode function (IMF) components and one trend term. The optimal SARIMA model for each component derived from the EMD decomposition was identified based on the lowest Akaike Information Criterion, and the residuals of all these models satisfied the white noise test (all P>0.05). The final prediction results of EMD-SARIMA model were obtained by summing the forecasts of each component. The EMD-SARIMA model achieved lower prediction errors, with its MSE, MAE, RMSE, and MAPE values all being lower than those of the single SARIMA model (0.283 vs. 0.745, 0.473 vs. 0.775, 0.532 vs. 0.863, and 13.587% vs. 21.115%). Conclusion  EMD-SARIMA model can more accurately predict the tuberculosis incidence trend in the Xinjiang Production and Construction Corps and has better application value compared to the single SARIMA model.

Key words: Pulmonary tuberculosis, Empirical mode decomposition, Seasonal autoregressive integrated moving average model, Prediction