热带病与寄生虫学 ›› 2025, Vol. 23 ›› Issue (3): 171-175,182.doi: 10.20199/j.issn.1672-2302.2025.03.008
李永盛1( ), 杜训波1, 龙露1, 魏荣杰2, 王瑶1(), 王亮1()
收稿日期:2024-11-09
出版日期:2025-06-20
发布日期:2025-08-08
通信作者:
王瑶,E-mail: 330146703@qq.com;王亮,E-mail: 363686849@qq.com
作者简介:李永盛,男,硕士,主管医师,研究方向:传染病控制。E-mail: 946678483@qq.com
基金资助:
LI Yongsheng1(), DU Xunbo1, LONG Lu1, WEI Rongjie2, WANG Yao1(), WANG Liang1()
Received:2024-11-09
Online:2025-06-20
Published:2025-08-08
Contact:
WANG Yao, E-mail: 330146703@qq.com; WANG Liang, E-mail: 363686849@qq.com
摘要:
目的 分析成都市猩红热的流行特征和时空聚集性,为猩红热的科学防控提供参考。方法 通过中国疾病预防控制信息系统获取2017—2023年成都市各区(市、县)街道/乡镇的猩红热监测数据,描述发病概况及三间分布特征,采用空间自相关分析和时空扫描分析方法分析时空聚集性。结果 2017—2023年成都市累计报告猩红热病例4 433例;报告发病率为1.41/10万~7.50/10万,整体呈波动下降趋势(χ2趋势=1 089.79,P<0.01)。4—6月(1 655例,占37.33%)和11月—次年1月(1 336例,占30.14%)为发病高峰期。3~8岁为高发年龄段(3 837例,占86.56%),男、女报告病例数分别为2 669例和1 764例,男性年均报告发病率(2.08/10万)高于女性(1.38/10万)。各地区中,邛崃市年均报告发病率最高(13.68/10万),新都区报告病例数最多(1 034例,占23.33%)。空间自相关分析发现,2017—2019年和2021—2023年成都市猩红热发病率呈空间正相关(Moran’s I均>0,Z均>1.960,P均<0.05),热点区域为新都区、邛崃市、双流区、龙泉驿区等区(市、县)的部分街道/乡镇;时空扫描分析共探测到1个一类聚集区和6个二类聚集区,一类聚集区为新都区,聚集时间为2017年1月—2019年1月。结论 成都市猩红热疫情整体呈波动下降趋势,具有明显的时空聚集性。应在高发季节加强对重点区域、重点人群的监测预警和宣传教育,减少疾病危害。
中图分类号:
李永盛, 杜训波, 龙露, 魏荣杰, 王瑶, 王亮. 2017—2023年成都市猩红热流行特征及时空聚集性分析[J]. 热带病与寄生虫学, 2025, 23(3): 171-175,182.
LI Yongsheng, DU Xunbo, LONG Lu, WEI Rongjie, WANG Yao, WANG Liang. Epidemiological characteristics and spatiotemporal distribution of scarlet fever in Chengdu City, 2017-2023[J]. Journal of Tropical Diseases and Parasitology, 2025, 23(3): 171-175,182.
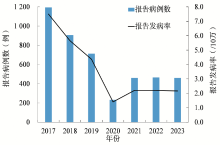
图1
2017—2023年成都市猩红热报告发病情况

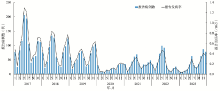
图2
2017—2023年成都市猩红热报告发病的时间分布

表1
2017—2023年成都市猩红热人群分布情况
| 特征 | 报告病例数(例) | 构成比(%) | |||||||
|---|---|---|---|---|---|---|---|---|---|
| 2017年 | 2018年 | 2019年 | 2020年 | 2021年 | 2022年 | 2023年 | 合计 | ||
| 性别 | |||||||||
| 男性 | 730 | 530 | 429 | 140 | 275 | 287 | 278 | 2 669 | 60.21 |
| 女性 | 464 | 377 | 284 | 93 | 185 | 179 | 182 | 1 764 | 39.79 |
| 年龄(岁) | |||||||||
| <1 | 6 | 2 | 2 | 0 | 2 | 0 | 1 | 13 | 0.29 |
| 1 | 23 | 19 | 10 | 10 | 14 | 4 | 6 | 86 | 1.94 |
| 2 | 34 | 26 | 20 | 21 | 14 | 11 | 16 | 142 | 3.20 |
| 3 | 94 | 81 | 59 | 25 | 40 | 35 | 29 | 363 | 8.19 |
| 4 | 221 | 95 | 103 | 26 | 80 | 77 | 51 | 653 | 14.73 |
| 5 | 272 | 187 | 137 | 32 | 86 | 85 | 58 | 857 | 19.33 |
| 6 | 238 | 230 | 166 | 48 | 107 | 112 | 109 | 1 010 | 22.78 |
| 7 | 143 | 128 | 105 | 30 | 59 | 74 | 99 | 638 | 14.39 |
| 8 | 73 | 57 | 44 | 17 | 40 | 40 | 45 | 316 | 7.13 |
| 9 | 41 | 22 | 25 | 5 | 9 | 15 | 26 | 143 | 3.23 |
| 10 | 15 | 22 | 9 | 5 | 3 | 6 | 11 | 71 | 1.60 |
| 11~14 | 26 | 22 | 12 | 8 | 3 | 4 | 7 | 82 | 1.85 |
| ≥15 | 8 | 16 | 21 | 6 | 3 | 3 | 2 | 59 | 1.33 |
| 职业 | |||||||||
| 幼托儿童 | 661 | 434 | 338 | 81 | 252 | 258 | 163 | 2 187 | 49.33 |
| 学生 | 406 | 367 | 313 | 95 | 166 | 184 | 265 | 1 796 | 40.51 |
| 散居儿童 | 123 | 93 | 54 | 54 | 40 | 24 | 30 | 418 | 9.43 |
| 其他 | 4 | 13 | 8 | 3 | 2 | 0 | 2 | 32 | 0.72 |
表2
2017—2023年成都市猩红热发病地区分布
| 地区 | 报告病例数(例) | 年均报告发病率 (/10万) | |||||||
|---|---|---|---|---|---|---|---|---|---|
| 2017年 | 2018年 | 2019年 | 2020年 | 2021年 | 2022年 | 2023年 | 合计 | ||
| 邛崃市 | 69 | 128 | 146 | 42 | 54 | 69 | 81 | 589 | 13.68 |
| 新都区 | 363 | 234 | 105 | 56 | 73 | 118 | 85 | 1 034 | 12.93 |
| 龙泉驿区 | 153 | 76 | 68 | 13 | 69 | 63 | 53 | 495 | 6.39 |
| 双流区 | 155 | 122 | 125 | 35 | 99 | 87 | 73 | 696 | 5.60 |
| 新津区 | 24 | 20 | 17 | 15 | 12 | 6 | 5 | 99 | 4.15 |
| 锦江区 | 43 | 40 | 26 | 4 | 19 | 19 | 19 | 170 | 3.08 |
| 武侯区 | 89 | 90 | 65 | 15 | 38 | 28 | 53 | 378 | 2.38 |
| 青羊区 | 51 | 36 | 19 | 4 | 13 | 15 | 10 | 148 | 2.38 |
| 金牛区 | 53 | 37 | 39 | 7 | 23 | 16 | 17 | 192 | 2.23 |
| 成华区 | 53 | 31 | 28 | 17 | 15 | 10 | 13 | 167 | 2.10 |
| 蒲江县 | 5 | 6 | 12 | 1 | 2 | 0 | 4 | 30 | 1.69 |
| 青白江区 | 8 | 8 | 8 | 3 | 7 | 2 | 7 | 43 | 1.39 |
| 郫都区 | 41 | 15 | 12 | 5 | 11 | 13 | 8 | 105 | 1.35 |
| 简阳市 | 24 | 23 | 17 | 5 | 7 | 10 | 16 | 102 | 1.35 |
| 温江区 | 13 | 25 | 12 | 3 | 2 | 0 | 3 | 58 | 1.19 |
| 金堂县 | 25 | 9 | 4 | 3 | 9 | 5 | 7 | 62 | 1.18 |
| 大邑县 | 6 | 0 | 5 | 3 | 5 | 2 | 0 | 21 | 0.59 |
| 彭州市 | 10 | 3 | 4 | 1 | 2 | 1 | 3 | 24 | 0.44 |
| 都江堰市 | 8 | 4 | 1 | 1 | 0 | 2 | 3 | 19 | 0.39 |
| 崇州市 | 1 | 0 | 0 | 0 | 0 | 0 | 0 | 1 | 0.02 |
表3
2017—2023年成都市街道/乡镇层面猩红热发病的全局空间自相关分析结果
| 年份 | Moran’s I值 | Z值 | P值 |
|---|---|---|---|
| 2017 | 0.028 | 2.195 | <0.05 |
| 2018 | 0.031 | 2.176 | <0.05 |
| 2019 | 0.048 | 3.130 | <0.05 |
| 2020 | 0.020 | 1.438 | >0.05 |
| 2021 | 0.093 | 5.739 | <0.01 |
| 2022 | 0.043 | 2.924 | <0.05 |
| 2023 | 0.080 | 4.916 | <0.01 |
表4
2017—2023年成都市猩红热发病数局部空间自相关分析结果
| 年份 | “高-高”聚集(个) | “低-低”聚集(个) | “高-低”聚集(个) | “低-高”聚集(个) |
|---|---|---|---|---|
| 2017 | 10个:新都区(6)、双流区(2)、龙泉驿区(1)、金牛区(1) | 71个:简阳市(27)、崇州市(14)、彭州市(7)、都江堰市(7)、温江区(4)、大邑县(4)、蒲江县(3)、金堂县(3)、郫都区(2) | 2个:金堂县(1)、简阳市(1) | 10个:青白江区(5)、龙泉驿区(2)、新都区(1)、双流区(1)、成华区(1) |
| 2018 | 14个:邛崃市(4)、新都区(3)、双流区(3)、武侯区(1)、青白江区(1)、锦江区(1)、金牛区(1) | 58个:简阳市(19)、崇州市(11)、都江堰市(9)、彭州市(8)、金堂县(7)、大邑县(4) | 2个:简阳市(1)、大邑县(1) | 5个:新都区(2)、青白江区(1)、金牛区(1)、大邑县(1) |
| 2019 | 17个:双流区(8)、邛崃市(5)、龙泉驿区(2)、武侯区(1)、 锦江区(1) | 58个:简阳市(18)、金堂县(12)、崇州市(12)、都江堰市(10)、彭州市(5)、温江区(1) | 2个:简阳市(1)、大邑县(1) | 11个:新都区(3)、锦江区(2)、双流区(1)、邛崃市(1)、青白江区(1)、蒲江县(1)、龙泉驿区(1)、大邑县(1) |
| 2020 | 12个:双流区(4)、邛崃市(4)、新都区(3)、青白江区(1) | 30个:简阳市(10)、崇州市(9)、都江堰市(4)、温江区(3)、郫都区(2)、金堂县(2) | 4个:简阳市(2)、金堂县(1)、都江堰市(1) | 5个:新都区(2)、青白江区(1)、金牛区(1)、大邑县(1) |
| 2021 | 20个:双流区(8)、龙泉驿区(5)、新都区(2)、武侯区(2)、 锦江区(2)、青白江区(1) | 62个:简阳市(23)、崇州市(12)、都江堰市(10)、彭州市(6)、温江区(5)、金堂县(4)、 蒲江县(1)、大邑县(1) | 3个:简阳市(2)、温江区(1) | 8个:双流区(3)、龙泉驿区(2)、新都区(1)、武侯区(1)、锦江区(1) |
| 2022 | 14个:双流区(5)、新都区(4)、邛崃市(2)、龙泉驿区(2)、 锦江区(1) | 42个:简阳市(13)、崇州市(12)、温江区(4)、都江堰市(4)、彭州市(3)、金堂县(3)、 大邑县(3) | 1个:金堂县(1) | 10个:青白江区(4)、双流区(3)、新都区(1)、邛崃市(1)、龙泉驿区(1) |
| 2023 | 19个:双流区(6)、邛崃市(5)、新都区(2)、武侯区(2)、龙泉驿区(2)、蒲江县(1)、锦江区(1) | 30个:崇州市(12)、大邑县(4)、温江区(3)、金堂县(3)、简阳市(3)、都江堰市(3)、郫都区(1)、彭州市(1) | 4个:简阳市(2)、新津区(1)、温江区(1) | 11个:双流区(3)、新都区(2)、锦江区(2)、邛崃市(1)、青白江区(1)、龙泉驿区(1)、大邑县(1) |
表5
2017—2023年成都市猩红热病例时空扫描分析结果
| 类型 | 聚集区域 | 聚集时间(年/月) | 实际病例数(例) | 理论病例数(例) | RR值 | LLR值 | P值 |
|---|---|---|---|---|---|---|---|
| 一类 | 新都区 | 2017/01—2019/01 | 611 | 55.89 | 12.52 | 943.06 | <0.001 |
| 二类 | 邛崃市 | 2017/04—2020/01 | 343 | 61.06 | 6.01 | 319.35 | <0.001 |
| 二类 | 龙泉驿区 | 2021/04—2021/07 | 193 | 41.08 | 4.87 | 149.33 | <0.001 |
| 二类 | 双流区、新津区 | 2017/01—2019/12 | 396 | 165.96 | 2.52 | 120.66 | <0.001 |
| 二类 | 武侯区、青羊区 | 2017/04—2017/07 | 89 | 34.10 | 2.64 | 30.82 | <0.001 |
| 二类 | 锦江区、成华区 | 2017/04—2017/07 | 56 | 18.41 | 3.07 | 24.86 | <0.001 |
| 二类 | 郫都区、温江区、金牛区 | 2017/04—2017/06 | 50 | 21.76 | 2.31 | 13.45 | <0.05 |
| [1] | 李兰娟. 传染病学[M]. 10版. 北京: 人民卫生出版社,2024:163-166. |
| [2] |
Park DW, Kim SH, Park JW, et al. Incidence and characteristics of scarlet fever, south Korea, 2008-2015[J]. Emerg Infect Dis, 2017, 23(4):658-661.
doi: 10.3201/eid2304.160773 pmid: 28322696 |
| [3] | You YH, Davies MR, Protani M, et al. Scarlet fever epidemic in China caused by Streptococcus pyogenes serotype M12: epidemiologic and molecular analysis[J]. E Bio Medicine, 2018,28:128-135. |
| [4] |
Yung CF, Thoon KC. A 12 year outbreak of scarlet fever in Singapore[J]. Lancet Infect Dis, 2018, 18(9):942.
doi: S1473-3099(18)30464-X pmid: 30152353 |
| [5] |
Venkatesan P. Rise in group A streptococcal infections in England[J]. Lancet Respir Med, 2023, 11(2):e16.
doi: 10.1016/S2213-2600(22)00507-0 pmid: 36549319 |
| [6] | World Health Organization. Increased incidence of scarlet fever and invasive Group A Streptococcus infection-multi-country[EB/OL]. (2022-12-15)[2024-10-10]. https://www.who.int/emergencies/disease-outbreak-news/item/2022-DON429. |
| [7] |
Liu YH, Chan TC, Yap LW, et al. Resurgence of scarlet fever in China: a 13-year population-based surveillance study[J]. Lancet Infect Dis, 2018, 18(8):903-912.
doi: S1473-3099(18)30231-7 pmid: 29858148 |
| [8] | 崔瑾钰, 张业武, 苏雪梅. 2010—2019年中国猩红热发病时空扫描分析[J]. 疾病监测, 2023, 38(3):287-293. |
| [9] | 李羚, 杜飞, 吕强, 等. 2015—2022年四川省猩红热流行特征和时空聚集性分析[J]. 预防医学情报杂志, 2024, 40(9):1080-1087. |
| [10] | 成都市卫生健康委员会. 2023年成都市卫生健康事业发展统计公报[EB/OL]. (2024-04-25)[2024-10-10]. https://cdwjw.chengdu.gov.cn/cdwjw/tongjishuju/2024-04/26/content_c39d5cd069084cbab902fb6d74af3ee7.shtml. |
| [11] | 廖如珺, 刘润友, 杨长虹. 四川省2009—2018年猩红热流行病学分析[J]. 传染病信息, 2019, 32(4):322-324,328. |
| [12] | Chan TC, King CC. Surveillance and epidemiology of infectious diseases using spatial and temporal lustering methods[J]. Infect Dis Inform Biosurveill, 2011,27:207-234. |
| [13] | 肖崇堃, 武依, 周丽君, 等. 2016—2020年四川省猩红热流行病学特征分析[J]. 预防医学情报杂志, 2023, 39(3):253-258,264. |
| [14] | 中华人民共和国民政部. 2022年中华人民共和国行政区划代码[EB/OL]. (2023-04-23)[2024-10-10]. https://www.mca.gov.cn/n156/n186/c110744/content.html. |
| [15] | 成都市规划和自然资源局. 《成都市城市总体规划(2011—2020年)》概况[EB/OL]. (2016-04-29)[2024-10-10]. https://mpnr.chengdu.gov.cn/ghhzrzyj/ztgh/2019-07/14/content_39be6057b8194c4d89afde1e26625a69.shtml. |
| [16] | Anselin L. Local indicators of spatial association: LISA[J]. Geogr Anal, 1995, 27(2):93-115. |
| [17] | GIS Geography. Spatial Autocorrelation and Moran’s I in GIS[EB/OL]. (2023-07-25) [2024-10-10]. https://gisgeography.com/spatial-autocorrelation-moran-i-gis/. |
| [18] | 殷菲. 时—空扫描统计量在传染病早期预警中的应用研究[D]. 成都: 四川大学,2007:109-115. |
| [19] | 四川省卫生健康委员会. 四川省法定传染病疫情概况[EB/OL]. (2024-01-12)[2024-10-10]. https://wsjkw.sc.gov.cn/scwsjkw/rdts/tygl_2.shtml. |
| [20] | 国家疾病预防控制局. 政府信息公开[EB/OL]. (2024-01-15)[2024-10-10]. https://www.ndcpa.gov.cn/jbkzzx/c100016/common/list.html. |
| [21] | 中华人民共和国中央人民政府. 中国抗疫“组合拳”成效显著[EB/OL]. (2020-02-14)[2024-10-10]. https://www.gov.cn/xinwen/2020-05/17/content_5512288.htm. |
| [22] | Fang Z, Ma CJ, Xu WL, et al. Epidemiological characteristics and trends of scarlet fever in Zhejiang Province of China: population-based surveillance during 2004-2022[J]. Can J Infect Dis Med Microbiol,2024:6257499. |
| [23] | 铁小茜, 赵昆. 公共卫生紧急状态下医疗资源分配的伦理反思[J]. 中国医学伦理学, 2022, 35(6):631-635. |
| [24] | Song SS, Wang P, Li J, et al. The indirect impact of control measures in COVID-19 pandemic on the incidence of other infectious diseases in China[J]. Public Health Pract (Oxf), 2022,4:100278. |
| [25] | Huh K, Jung J, Hong J, et al. Impact of nonpharmaceutical interventions on the incidence of respiratory infections during the coronavirus disease 2019 (COVID-19) outbreak in Korea: a nationwide surveillance study[J]. Clin Infect Dis, 2021, 72(7):e184-e191. |
| [26] | Lu QB, Wu HC, Ding ZY, et al. Analysis of epidemiological characteristics of scarlet fever in Zhejiang Province, China, 2004-2018[J]. Int J Environ Res Public Health, 2019, 16(18):3454. |
| [27] | Mahara G, Wang C, Huo D, et al. Spatiotemporal pattern analysis of scarlet fever incidence in Beijing, China, 2005-2014[J]. Int J Environ Res Public Health, 2016, 13(1):131. |
| [1] | 傅佳璐, 郑尔达, 戚艳波, 吴林波, 何继波, 杨锐. 2005—2023年云南省境外输入登革热流行特征及预测研究[J]. 热带病与寄生虫学, 2025, 23(4): 199-204,210. |
| [2] | 陈琴, 吴利楠, 赖石凤, 蒋明明, 刘文辉. 2014—2023年广州市登革热流行病学特征分析[J]. 热带病与寄生虫学, 2025, 23(4): 205-210. |
| [3] | 严可, 冯静, 周蓉, 杜训波, 刘辉, 王瑶. 2011—2023年成都市登革热流行特征和时间趋势分析[J]. 热带病与寄生虫学, 2025, 23(4): 211-215. |
| [4] | 郑尔达, 贾豫晨, 刘思娴, 沈秀莲, 黄甜, 何继波, 刘慧慧. 云南省诺如病毒感染流行特征与趋势预测[J]. 热带病与寄生虫学, 2025, 23(4): 222-228. |
| [5] | 赵锦, 周银柱, 邱劲松, 陈水连. 2014—2023年长沙市水痘流行特征与传播动力学分析[J]. 热带病与寄生虫学, 2025, 23(4): 229-234. |
| [6] | 黄璐璐, 刘婧姝, 周正斌, 罗卓韦, 李元元, 陈军虎, 李石柱. 2011—2023年我国犬源型内脏利什曼病流行特征分析[J]. 热带病与寄生虫学, 2025, 23(3): 131-136,148. |
| [7] | 苏颖, 王斌冰, 柴瑜, 董燕, 王军平, 张宁, 宋菲扬. 2012—2024年安徽省急性乙型肝炎流行特征及疫苗接种情况分析[J]. 热带病与寄生虫学, 2025, 23(3): 144-148. |
| [8] | 翟前前, 刘慧慧, 王俊锋, 蔡剑, 安光旭, 张洋, 姚来顺. 2011—2023年吉林省肾综合征出血热流行特征及时空聚集性分析[J]. 热带病与寄生虫学, 2025, 23(3): 165-170. |
| [9] | 刘言哲, 宋杨, 刘凤凤, 丁凡, 沈若寒, 孟欣, 张彦平, 常昭瑞. 2010―2022年我国柯萨奇病毒A16型手足口病流行特征分析[J]. 热带病与寄生虫学, 2025, 23(2): 65-69,97. |
| [10] | 李则颖, 林燕, 贾豫晨, 黄甜, 郑尔达, 沈秀莲, 陈莉华, 何继波. 2020—2024年云南省手足口病再感染病例的流行特征及风险因素分析[J]. 热带病与寄生虫学, 2025, 23(2): 70-74,80. |
| [11] | 于欣桐, 赵庆龙, 徐长喜, 李美娜. 2017—2023年吉林省手足口病流行特征及病原学结果分析[J]. 热带病与寄生虫学, 2025, 23(2): 81-85. |
| [12] | 代敏, 赵振希, 张筱碟, 张小乔, 谢鹏留, 凌珏, 陆渊, 毛志鹏. 2010—2024年昆明市手足口病流行病学特征与病原学监测结果分析[J]. 热带病与寄生虫学, 2025, 23(2): 86-90,115. |
| [13] | 徐凯, 王瑶, 速丽媛, 冯松颀, 程悦, 刘辉. 2014—2023年成都市手足口病流行特征及时空聚集性分析[J]. 热带病与寄生虫学, 2025, 23(2): 91-97. |
| [14] | 周蓉, 冯松颀, 黎明, 陈立煌, 王瑶. 成都市一起疑似因通风井传播的鹦鹉热疫情调查[J]. 热带病与寄生虫学, 2025, 23(2): 122-124. |
| [15] | 戴志辉, 林慧君, 周帅锋, 杨子琪, 陈生宝, 邓志红, 罗垲炜. 2014—2023年湖南省其他感染性腹泻流行特征分析[J]. 热带病与寄生虫学, 2025, 23(1): 7-11. |
| 阅读次数 | ||||||
|
全文 |
|
|||||
|
摘要 |
|
|||||