Journal of Tropical Diseases and Parasitology ›› 2024, Vol. 22 ›› Issue (5): 277-283.doi: 10.20199/j.issn.1672-2302.2024.05.005
• CONTROL STUDIES • Previous Articles Next Articles
WU Xiaohong( ), TIAN Hongchun, LUO Jingwen, TIE Lei, DENG Xiu, ZHANG Suping, LIU Yang()
Received:2024-02-23
Online:2024-10-20
Published:2024-11-15
Contact:
LIU Yang, E-mail: evita_6161@163.com
CLC Number:
WU Xiaohong, TIAN Hongchun, LUO Jingwen, TIE Lei, DENG Xiu, ZHANG Suping, LIU Yang. Distribution characteristics and spatio-temporal analysis of soil-transmitted nematode in the hilly areas of Sichuan Province from 2016 to 2023[J]. Journal of Tropical Diseases and Parasitology, 2024, 22(5): 277-283.
Add to citation manager EndNote|Ris|BibTeX
URL: http://www.rdbzz.com/EN/10.20199/j.issn.1672-2302.2024.05.005
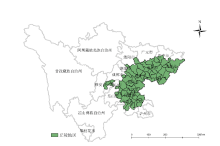
Figure 1
Distribution of counties (cities / districts) in the hilly areas in Sichuan Province

Table 1
Soil-transmitted nematode infections in different populations in hilly areas of Sichuan Province from 2016 to 2023
| 人群特征 | 调查 人数 | 土源性线虫 | 钩虫 | 蛔虫 | 鞭虫 | 混合感染 | |||||||||
|---|---|---|---|---|---|---|---|---|---|---|---|---|---|---|---|
| 感染 人数 | 感染率(%) | 感染 人数 | 感染率(%) | 感染 人数 | 感染率(%) | 感染 人数 | 感染率(%) | 感染 人数 | 感染率(%) | ||||||
| 性别 | |||||||||||||||
| 男 | 42 912 | 3 725 | 8.68 | 3 492 | 8.14 | 217 | 0.51 | 85 | 0.20 | 60 | 0.14 | ||||
| 女 | 46 314 | 4 350 | 9.39 | 4 110 | 8.87 | 248 | 0.54 | 64 | 0.14 | 70 | 0.15 | ||||
| χ2值 | 13.71 | 15.51 | 0.38 | 4.79 | 0.20 | ||||||||||
| P值 | <0.01 | <0.01 | >0.05 | <0.05 | >0.05 | ||||||||||
| 年龄组(岁) | |||||||||||||||
| ≤ 9 | 7 976 | 235 | 2.95 | 158 | 1.98 | 73 | 0.92 | 18 | 0.23 | 13 | 0.16 | ||||
| 10~19 | 6 457 | 278 | 4.31 | 214 | 3.32 | 51 | 0.79 | 18 | 0.28 | 5 | 0.08 | ||||
| 20~29 | 4 018 | 190 | 4.73 | 177 | 4.41 | 13 | 0.32 | 1 | 0.02 | 1 | 0.02 | ||||
| 30~39 | 5 890 | 295 | 5.01 | 273 | 4.63 | 19 | 0.32 | 8 | 0.14 | 5 | 0.08 | ||||
| 40~49 | 12 546 | 823 | 6.56 | 771 | 6.15 | 46 | 0.37 | 23 | 0.18 | 13 | 0.10 | ||||
| 50~59 | 16 947 | 1 278 | 7.54 | 1 214 | 7.16 | 60 | 0.35 | 26 | 0.15 | 20 | 0.12 | ||||
| 60~69 | 19 419 | 2 576 | 13.27 | 2 467 | 12.70 | 122 | 0.63 | 33 | 0.17 | 43 | 0.22 | ||||
| ≥ 70 | 15 973 | 2 400 | 15.03 | 2 328 | 14.57 | 81 | 0.51 | 22 | 0.14 | 30 | 0.19 | ||||
| χ2值 | 1 675.73* | 2 181.65 | 59.65 | 12.92 | 19.78 | ||||||||||
| P值 | <0.01 | <0.01 | <0.01 | >0.05 | <0.05 | ||||||||||
| 文化程度 | |||||||||||||||
| 文盲或半文盲 | 10 738 | 1 505 | 14.02 | 1 436 | 13.37 | 81 | 0.75 | 25 | 0.23 | 34 | 0.32 | ||||
| 学龄前儿童 | 6 899 | 732 | 10.61 | 679 | 9.84 | 50 | 0.72 | 14 | 0.20 | 11 | 0.16 | ||||
| 小学 | 41 371 | 4 211 | 10.18 | 3 995 | 9.66 | 215 | 0.52 | 76 | 0.18 | 68 | 0.16 | ||||
| 初中 | 22 979 | 1 391 | 6.05 | 1 285 | 5.59 | 93 | 0.40 | 28 | 0.12 | 14 | 0.06 | ||||
| 高中、中专或中技 | 5 949 | 208 | 3.50 | 185 | 3.11 | 22 | 0.37 | 4 | 0.07 | 3 | 0.05 | ||||
| 大专及以上 | 1 290 | 28 | 2.17 | 22 | 1.71 | 4 | 0.31 | 2 | 0.16 | 0 | 0 | ||||
| χ2值 | 883.37* | 961.54 | 26.53 | 10.39 | 39.59 | ||||||||||
| P值 | <0.01 | <0.01 | <0.01 | >0.05 | <0.01 | ||||||||||
| 职业 | |||||||||||||||
| 农牧民 | 69 990 | 7 376 | 10.54 | 7 048 | 10.07 | 341 | 0.49 | 109 | 0.16 | 112 | 0.16 | ||||
| 服务人员 | 1 658 | 88 | 5.31 | 84 | 5.07 | 1 | 0.06 | 4 | 0.24 | 1 | 0.06 | ||||
| 民工、工人 | 2 057 | 93 | 4.52 | 87 | 4.23 | 3 | 0.15 | 3 | 0.15 | 0 | 0 | ||||
| 散居儿童 | 553 | 23 | 4.16 | 16 | 2.89 | 7 | 1.27 | 1 | 0.18 | 1 | 0.18 | ||||
| 学生 | 10 714 | 393 | 3.67 | 286 | 2.67 | 95 | 0.89 | 27 | 0.25 | 14 | 0.13 | ||||
| 幼托儿童 | 2 754 | 75 | 2.72 | 55 | 2.00 | 17 | 0.62 | 5 | 0.18 | 2 | 0.07 | ||||
| 医务人员、教师、干部 | 1 203 | 20 | 1.66 | 20 | 1.66 | 0 | 0 | 0 | 0 | 0 | 0 | ||||
| 其他 | 297 | 7 | 2.36 | 6 | 2.02 | 1 | 0.34 | 0 | 0 | 0 | 0 | ||||
| χ2值 | 890.86 | 1 021.72 | 54.45 | 8.33 | 8.23 | ||||||||||
| P值 | <0.01 | <0.01 | <0.01 | >0.05 | >0.05 | ||||||||||
Table 2
Soil-transmitted nematode infections in counties (cities/ districts) in hilly areas of Sichuan Province from 2016 to 2023
| 县(市、区) | 调查人数 | 土源性线虫 | 钩虫 | 蛔虫 | 鞭虫 | ||||||||||||||||||
|---|---|---|---|---|---|---|---|---|---|---|---|---|---|---|---|---|---|---|---|---|---|---|---|
| 感染 人数 | 感染率 (%) | 感染 人数 | 感染率 (%) | 感染 人数 | 感染率 (%) | 感染 人数 | 感染率 (%) | ||||||||||||||||
| 成都市 | |||||||||||||||||||||||
| 金堂县 | 1 008 | 47 | 4.66 | 47 | 4.66 | 0 | 0 | 0 | 0 | ||||||||||||||
| 简阳市 | 1 009 | 40 | 3.96 | 37 | 3.67 | 3 | 0.30 | 0 | 0 | ||||||||||||||
| 龙泉驿区 | 1 000 | 4 | 0.40 | 4 | 0.40 | 0 | 0 | 0 | 0 | ||||||||||||||
| 蒲江县 | 1 012 | 17 | 1.68 | 17 | 1.68 | 0 | 0 | 0 | 0 | ||||||||||||||
| 自贡市 | |||||||||||||||||||||||
| 自流井区 | 1 030 | 127 | 12.33 | 124 | 12.04 | 4 | 0.39 | 4 | 0.39 | ||||||||||||||
| 贡井区 | 1 002 | 96 | 9.58 | 96 | 9.58 | 0 | 0 | 0 | 0 | ||||||||||||||
| 大安区 | 1 045 | 131 | 12.54 | 130 | 12.44 | 1 | 0.10 | 0 | 0 | ||||||||||||||
| 沿滩区 | 1 028 | 222 | 21.60 | 220 | 21.40 | 2 | 0.19 | 2 | 0.19 | ||||||||||||||
| 荣县 | 1 000 | 252 | 25.20 | 250 | 25.00 | 3 | 0.30 | 0 | 0 | ||||||||||||||
| 富顺县 | 1 100 | 239 | 21.73 | 236 | 21.45 | 1 | 0.09 | 2 | 0.18 | ||||||||||||||
| 泸州市 | |||||||||||||||||||||||
| 纳溪区 | 1 000 | 219 | 21.90 | 209 | 20.90 | 7 | 0.70 | 3 | 0.30 | ||||||||||||||
| 江阳区 | 1 000 | 112 | 11.20 | 109 | 10.90 | 0 | 0 | 5 | 0.50 | ||||||||||||||
| 龙马潭区 | 2 032 | 222 | 10.93 | 217 | 10.68 | 4 | 0.20 | 4 | 0.20 | ||||||||||||||
| 泸县 | 4 000 | 757 | 18.93 | 729 | 18.23 | 34 | 0.85 | 8 | 0.20 | ||||||||||||||
| 德阳市 | |||||||||||||||||||||||
| 中江县 | 1 017 | 83 | 8.16 | 83 | 8.16 | 4 | 0.39 | 0 | 0 | ||||||||||||||
| 罗江区 | 1 000 | 46 | 4.60 | 46 | 4.60 | 0 | 0 | 0 | 0 | ||||||||||||||
| 绵阳市 | |||||||||||||||||||||||
| 盐亭县 | 1 022 | 56 | 5.48 | 52 | 5.09 | 2 | 0.20 | 2 | 0.20 | ||||||||||||||
| 梓潼县 | 1 000 | 23 | 2.30 | 2 | 0.20 | 21 | 2.10 | 0 | 0 | ||||||||||||||
| 三台县 | 1 002 | 68 | 6.79 | 66 | 6.59 | 1 | 0.10 | 1 | 0.10 | ||||||||||||||
| 遂宁市 | |||||||||||||||||||||||
| 射洪县 | 1 009 | 9 | 0.89 | 4 | 0.40 | 4 | 0.40 | 1 | 0.10 | ||||||||||||||
| 蓬溪县 | 1 091 | 69 | 6.32 | 53 | 4.86 | 14 | 1.28 | 3 | 0.27 | ||||||||||||||
| 安居区 | 1 005 | 124 | 12.34 | 123 | 12.24 | 1 | 0.10 | 2 | 0.20 | ||||||||||||||
| 船山区 | 1 000 | 100 | 10.00 | 97 | 9.70 | 3 | 0.30 | 2 | 0.20 | ||||||||||||||
| 大英县 | 1 000 | 102 | 10.20 | 85 | 8.50 | 20 | 2.00 | 4 | 0.40 | ||||||||||||||
| 内江市 | |||||||||||||||||||||||
| 市中区 | 1 084 | 62 | 5.72 | 59 | 5.44 | 3 | 0.28 | 1 | 0.09 | ||||||||||||||
| 东兴区 | 1 006 | 123 | 12.23 | 119 | 11.83 | 1 | 0.10 | 4 | 0.40 | ||||||||||||||
| 威远县 | 1 040 | 36 | 3.46 | 30 | 2.88 | 5 | 0.48 | 1 | 0.10 | ||||||||||||||
| 隆昌市 | 1 000 | 162 | 16.20 | 160 | 16.00 | 0 | 0 | 2 | 0.20 | ||||||||||||||
| 资中县 | 1 000 | 174 | 17.40 | 168 | 16.80 | 8 | 0.80 | 3 | 0.30 | ||||||||||||||
| 乐山市 | |||||||||||||||||||||||
| 五通桥区 | 8 085 | 467 | 5.78 | 438 | 5.42 | 14 | 0.17 | 20 | 0.25 | ||||||||||||||
| 犍为县 | 1 057 | 102 | 9.65 | 94 | 8.89 | 3 | 0.28 | 6 | 0.57 | ||||||||||||||
| 井研县 | 1 000 | 19 | 1.90 | 16 | 1.60 | 0 | 0 | 3 | 0.30 | ||||||||||||||
| 南充市 | |||||||||||||||||||||||
| 嘉陵区 | 1 000 | 63 | 6.30 | 60 | 6.00 | 1 | 0.10 | 2 | 0.20 | ||||||||||||||
| 顺庆区 | 1 000 | 156 | 15.60 | 146 | 14.60 | 13 | 1.30 | 1 | 0.10 | ||||||||||||||
| 高坪区 | 1 000 | 48 | 4.80 | 47 | 4.70 | 1 | 0.10 | 0 | 0 | ||||||||||||||
| 阆中市 | 1 019 | 48 | 4.71 | 22 | 2.16 | 26 | 2.55 | 1 | 0.10 | ||||||||||||||
| 营山县 | 1 035 | 27 | 2.61 | 25 | 2.42 | 2 | 0.19 | 0 | 0 | ||||||||||||||
| 西充县 | 1 028 | 16 | 1.56 | 5 | 0.49 | 11 | 1.07 | 1 | 0.10 | ||||||||||||||
| 仪陇县 | 1 009 | 87 | 8.62 | 84 | 8.33 | 3 | 0.30 | 0 | 0 | ||||||||||||||
| 蓬安县 | 1 001 | 38 | 3.80 | 32 | 3.20 | 4 | 0.40 | 2 | 0.20 | ||||||||||||||
| 南部县 | 1 049 | 168 | 16.02 | 149 | 14.20 | 26 | 2.48 | 9 | 0.86 | ||||||||||||||
| 眉山市 | |||||||||||||||||||||||
| 仁寿县 | 1 021 | 32 | 3.13 | 32 | 3.13 | 0 | 0 | 0 | 0 | ||||||||||||||
| 丹棱县 | 7 073 | 141 | 1.99 | 139 | 1.97 | 2 | 0.03 | 0 | 0 | ||||||||||||||
| 青神县 | 1 000 | 48 | 4.80 | 42 | 4.20 | 7 | 0.70 | 0 | 0 | ||||||||||||||
| 宜宾市 | |||||||||||||||||||||||
| 翠屏区 | 1 000 | 78 | 7.80 | 76 | 7.60 | 0 | 0 | 3 | 0.30 | ||||||||||||||
| 高县 | 1 000 | 103 | 10.30 | 100 | 10.00 | 2 | 0.20 | 1 | 0.10 | ||||||||||||||
| 南溪区 | 1 026 | 193 | 18.81 | 193 | 18.81 | 0 | 0 | 0 | 0 | ||||||||||||||
| 江安县 | 1 001 | 226 | 22.58 | 211 | 21.08 | 17 | 1.70 | 5 | 0.50 | ||||||||||||||
| 长宁县 | 1 000 | 191 | 19.10 | 100 | 10.00 | 89 | 8.90 | 31 | 3.10 | ||||||||||||||
| 叙州区 | 1 000 | 167 | 16.70 | 159 | 15.90 | 8 | 0.80 | 2 | 0.20 | ||||||||||||||
| 广安市 | |||||||||||||||||||||||
| 广安区 | 1 015 | 25 | 2.46 | 25 | 2.46 | 0 | 0 | 0 | 0 | ||||||||||||||
| 前锋区 | 1 001 | 27 | 2.70 | 25 | 2.50 | 2 | 0.20 | 0 | 0 | ||||||||||||||
| 岳池县 | 1 011 | 279 | 27.60 | 277 | 27.40 | 8 | 0.79 | 1 | 0.10 | ||||||||||||||
| 武胜县 | 1 000 | 209 | 20.90 | 209 | 20.90 | 0 | 0 | 0 | 0 | ||||||||||||||
| 邻水县 | 1 008 | 205 | 20.34 | 200 | 19.84 | 8 | 0.79 | 0 | 0 | ||||||||||||||
| 华蓥市 | 1 046 | 83 | 7.93 | 83 | 7.93 | 0 | 0 | 0 | 0 | ||||||||||||||
| 达州市 | |||||||||||||||||||||||
| 开江县 | 1 009 | 66 | 6.54 | 50 | 4.96 | 16 | 1.59 | 2 | 0.20 | ||||||||||||||
| 大竹县 | 1 064 | 11 | 1.03 | 3 | 0.28 | 7 | 0.66 | 1 | 0.09 | ||||||||||||||
| 宣汉县 | 1 004 | 36 | 3.59 | 33 | 3.29 | 3 | 0.30 | 0 | 0 | ||||||||||||||
| 渠县 | 1 015 | 141 | 13.89 | 139 | 13.69 | 2 | 0.20 | 0 | 0 | ||||||||||||||
| 通川区 | 1 041 | 65 | 6.24 | 65 | 6.24 | 0 | 0 | 0 | 0 | ||||||||||||||
| 达川区 | 999 | 82 | 8.21 | 77 | 7.71 | 7 | 0.70 | 0 | 0 | ||||||||||||||
| 雅安市 | |||||||||||||||||||||||
| 雨城区 | 2 008 | 52 | 2.59 | 50 | 2.49 | 1 | 0.05 | 1 | 0.05 | ||||||||||||||
| 名山区 | 1 027 | 127 | 12.37 | 126 | 12.27 | 4 | 0.39 | 1 | 0.10 | ||||||||||||||
| 巴中市 | |||||||||||||||||||||||
| 巴州区 | 1 028 | 58 | 5.64 | 56 | 5.45 | 2 | 0.19 | 0 | 0 | ||||||||||||||
| 恩阳区 | 1 000 | 58 | 5.80 | 47 | 4.70 | 11 | 1.10 | 1 | 0.10 | ||||||||||||||
| 平昌县 | 1 001 | 102 | 10.19 | 89 | 8.89 | 15 | 1.50 | 0 | 0 | ||||||||||||||
| 资阳市 | |||||||||||||||||||||||
| 雁江区 | 1 000 | 56 | 5.60 | 55 | 5.50 | 1 | 0.10 | 0 | 0 | ||||||||||||||
| 安岳县 | 1 003 | 149 | 14.86 | 149 | 14.86 | 0 | 0 | 0 | 0 | ||||||||||||||
| 乐至县 | 1 000 | 104 | 10.40 | 102 | 10.20 | 3 | 0.30 | 1 | 0.10 | ||||||||||||||
| 合计 | 89 226 | 8 075 | 9.05 | 7 602 | 8.52 | 465 | 0.52 | 149 | 0.17 | ||||||||||||||

Figure 2
Distribution of soil-transmitted nematodes infections in the hilly areas of Sichuan Province
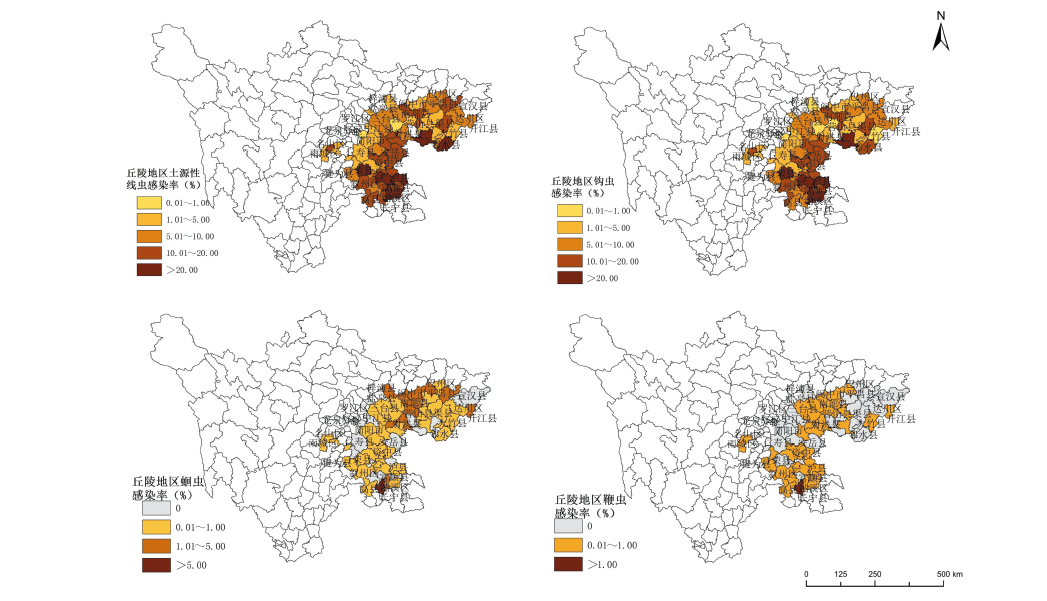
Table 3
Results of global spatial autocorrelation analysis of soil-transmitted nematode infection in the hilly areas of Sichuan Province
| 类型 | Moran′s I | Z值 | P值 |
|---|---|---|---|
| 土源性线虫 | 0.193 | 2.73 | <0.01 |
| 钩虫 | 0.187 | 2.63 | <0.01 |
| 蛔虫 | 0.023 | 0.69 | >0.05 |
| 鞭虫 | 0.058 | 1.59 | >0.05 |
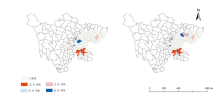
Figure 3
Local spatial autocorrelation distribution map of soil-transmitted nematode and hookworm infection rates in the hilly areas of Sichuan Province
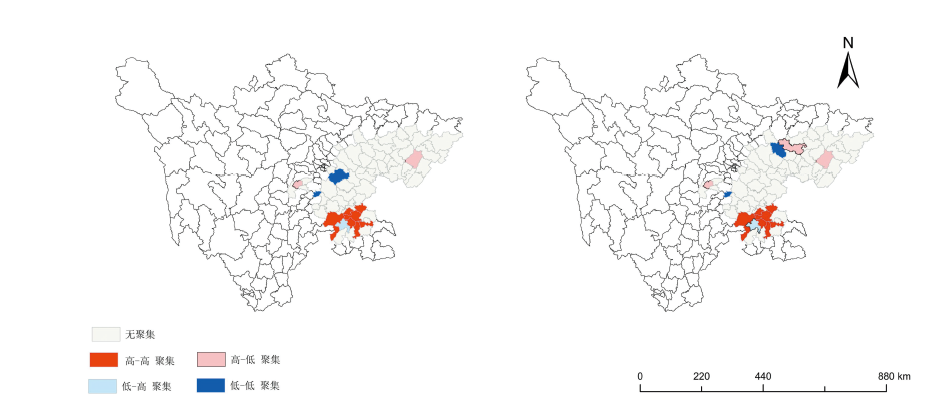
Table 4
Results of local spatial autocorrelation analysis of soil-transmitted nematode and hookworm infection rates in hilly areas of Sichuan Province
| 聚集区类型 | 土源性线虫 | 钩虫 |
|---|---|---|
| “高-高”聚集 | 隆昌市、富顺县、 沿滩区、叙州区、南溪区、江阳区、江安县 | 隆昌市、富顺县、 沿滩区、叙州区、南溪区、江阳区、江安县 |
| “高-低”聚集 | 名山区、渠县 | 名山区、渠县、南部县 |
| “低-高”聚集 | 翠屏区 | 翠屏区 |
| “低-低”聚集 | 简阳市、青神县 | 青神县、盐亭县 |
| [1] | 中华人民共和国国家卫生健康委员会. 土源性线虫病的传播控制与阻断:WS/T 629—2018[S/OL]. [2024-02-09]. http://www.nhc.gov.cn/ewebeditor/uploadfile/2018/10/20181025132702336.pdf. |
| [2] | 周晓农. 2015年全国人体重点寄生虫病现状调查报告[M]. 北京: 人民卫生出版社,2018:37. |
| [3] |
朱慧慧, 黄继磊, 诸廷俊, 等. 2017年全国土源性线虫感染监测数据分析[J]. 中国寄生虫学与寄生虫病杂志, 2019, 37(1):12-17.
doi: 10.12140/j.issn.1000-7423.2019.01.003 |
| [4] | Zhu HH, Huang JL, Zhou CH, et al. Soil-Transmitted Helminthiasis-China, 2018[J]. China CDC Wkly, 2020, 2(3):34-38. |
| [5] |
朱慧慧, 黄继磊, 陈颖丹, 等. 2019年全国土源性线虫感染状况分析[J]. 中国寄生虫学与寄生虫病杂志, 2021, 39(5):666-673.
doi: 10.12140/j.issn.1000-7423.2021.05.015 |
| [6] | 田洪春, 谢红, 刘常华, 等. 2005—2009年四川省土源性线虫病流行趋势分析[J]. 预防医学情报杂志, 2010, 26(9):688-693. |
| [7] | 吴小红, 田洪春, 罗静雯, 等. 2016—2021年四川省土源性线虫病时空分布特征[J]. 中国血吸虫病防治杂志, 2022, 34(5):484-492. |
| [8] | 谢红, 田洪春, 王信刚, 等. 2006—2009年四川国家级监测点人群土源性线虫病监测结果分析[J]. 预防医学情报杂志, 2011, 27(7):495-499. |
| [9] | 罗静雯, 田洪春, 谢红, 等. 2015年四川省肠道蠕虫感染调查报告[J]. 寄生虫病与感染性疾病, 2020, 18(2):64-69. |
| [10] | 四川省疾病预防控制中心. 四川省疾病预防控制中心关于印发四川省肝吸虫病和土源性线虫病监测方案(试行)的通知:川疾函〔2017〕121号[A]. 成都:四川省疾病预防控制中心, 2017. |
| [11] | 徐丽, 方亚. 空间流行病学中的疾病制图常用方法[J]. 中国卫生统计, 2015, 32(2):338-341. |
| [12] | 周晓农. 空间流行病学[M]. 北京: 科学出版社,2009:19-21. |
| [13] |
公衍峰, 郑金鑫, 胡小康, 等. 空间流行病学在寄生虫病传播风险研究中的应用[J]. 中国寄生虫学与寄生虫病杂志, 2021, 39(1):101-106.
doi: 10.12140/j.issn.1000-7423.2021.01.015 |
| [14] |
罗静雯, 田洪春, 铁磊, 等. 2016—2021年四川省人群土源性线虫感染情况分析[J]. 中国寄生虫学与寄生虫病杂志, 2023, 41(2):192-197.
doi: 10.12140/j.issn.1000-7423.2023.02.010 |
| [15] |
陈喆, 葛军, 温琪, 等. 江西省2016—2019年土源性线虫病时空聚集性分析[J]. 中国热带医学, 2022, 22(9):825-831.
doi: 10.13604/j.cnki.46-1064/r.2022.09.08 |
| [16] | 谢贤良, 陈云虹, 高澜琳, 等. 2016—2020 年福建省土源性线虫病监测结果分析[J]. 热带病与寄生虫学, 2021, 19(3):135-138. |
| [17] | 张米禛, 黄继磊, 朱慧慧, 等. 2020年全国人体土源性线虫感染情况分析[J]. 中国血吸虫病防治杂志, 2023, 41(3):331-335,343. |
| [18] | 周晓农, 杨国静, 杨坤, 等. 中国空间流行病学的发展历程与发展趋势[J]. 中华流行病学杂志, 2011, 32(9):854-858. |
| [19] | 周艺彪. 加强空间流行病学研究与应用助推我国寄生虫病精准防控[J]. 中国血吸虫病防治杂志, 2019, 31(4):356-357. |
| [20] | 孙利谦, 胡艺, 李锐, 等. 地方病空间流行病学分析方法的研究进展[J]. 中华地方病学杂志, 2015, 34(8):614-616. |
| [21] | 钱门宝, 李石柱, 周晓农. 我国土源性线虫病的流行和控制[J]. 热带病与寄生虫学, 2022, 20(3):126-129. |
| [1] | YU Guolong, CHEN Siting, LIU Feng, LIN Haiduan, YE Bili, XIE Xianqing, JIN Yujuan. Predicting the infection status and epidemic trend of SARS-CoV-2 using transmission dynamics model based on Longgang District of Shenzhen City [J]. Journal of Tropical Diseases and Parasitology, 2023, 21(6): 338-343. |
| [2] | YIN Weigang, HE Yisha, YANG Peicai. Investigation on the status of Enterobius vermicularis infection among kindergarten children in Nanjing area [J]. Journal of Tropical Diseases and Parasitology, 2023, 21(6): 344-348. |
| [3] | FAN Zehan, WANG Weichun, ZHAN Ti, DUAN Yongmei, ZHU Yingfu, XIANG Kexia, JIANG Xiaoyu, LUO Yin, HE Jiachang, CAO Zhiguo. Investigation on prevalence of Schistosoma japonicum infections in wild mice in Ma'anshan City [J]. Journal of Tropical Diseases and Parasitology, 2023, 21(6): 349-352. |
| [4] | HAO Cai-xia, LIU Ya-qiong, LIAO Xue-chun, YUAN Heng. Epidemiological characteristics of other infectious diarrhea in Sichuan Province from 2017 to 2021 [J]. Journal of Tropical Diseases and Parasitology, 2023, 21(1): 7-12. |
| [5] | WANG Qiu-yue, FAN Gui-sheng, CHEN Zhi-yang, WANG Wei-ming. Analysis on the mobile surveillance results of soil-transmitted nematode infection in Quanzhou City from 2017 to 2021 [J]. Journal of Tropical Diseases and Parasitology, 2022, 20(5): 249-252. |
| [6] | SHI Dan-dan, KUAI Yan, HAN Shuai, WU Wei-ping. Spatial cluster analysis of echinococcosis in the eastern Qinghai-Tibet Plateau from 2016 to 2020 [J]. Journal of Tropical Diseases and Parasitology, 2022, 20(2): 64-68. |
| [7] | DU Ling, ZHANG Jin-juan, TIAN Yan-li, HAN Li-na, LEI Yu. Analysis on the surveillance results of soil-transmitted nematode infection in population in Pingdingshan City from 2016 to 2019 [J]. Journal of Tropical Diseases and Parasitology, 2021, 19(4): 207-. |
| [8] | LUO Jing-wen, TIAN Hong-chun, XIE Hong, TIE Lei, ZHANG Li-ping, GONG Xi, LÜ Cheng-shen. Analysis on the surveillance results of clonorchiasis in Sichuan Province from 2016 to 2020 [J]. Journal of Tropical Diseases and Parasitology, 2021, 19(3): 127-130,150. |
| [9] | XIE Xian-liang, CHEN Yun-hong, GAO Lan-lin, XIE Han-guo. Analysis on the surveillance results of soil-transmitted nematodes in Fujian Province from 2016 to 2020 [J]. Journal of Tropical Diseases and Parasitology, 2021, 19(3): 135-138. |
| [10] | DAI Si-min, MA Xiao-jiang, ZHANG Yao-guang, WANG Zhen-yu, ZHU Min, ZHANG Chen-gang, ZHOU Yi-bin, PAN Hao, WU Huan-yu. Investigation and analysis on soil-transmitted nematode diseases and key food-borne parasitic diseases in Shanghai Municipality from 2016 to 2020 [J]. Journal of Tropical Diseases and Parasitology, 2021, 19(3): 143-145,159. |
| [11] | LI Yun-xia, NING Chao-qun, TIAN Li-guang, LI Ke-wei, CAO Yu-hong, LÜ Xiao-xue, LIANG Li-yuan. Analysis of soil-transmitted nematode infection in population in mobile surveillance sites of Luoyang City from 2017 to 2020 [J]. Journal of Tropical Diseases and Parasitology, 2021, 19(3): 160-163. |
| [12] | WEI Hong-sheng, PAN Xiao-xiang, ZHU Li, WU Ping-ting, WU Jun. Analysis on the surveillance results of soil-transmitted nematodes in Hefei City from 2016 to 2020 [J]. Journal of Tropical Diseases and Parasitology, 2021, 19(3): 167-169. |
| [13] | LI Hai-yan, HE Bin, TANG Wen-qian, PAN Hai, ZHANG Li-juan, YANG Jian-jun, SHI Yun-liang, JIANG Zhi-hua∗. Investigation and analysis of Clonorchis sinensis and soil-transmitted nematode infections in Xing'an County of Guangxi [J]. Journal of Tropical Diseases and Parasitology, 2020, 18(2): 118-120,131. |
| [14] | Ji Jingxiu1, ZhangMiao1, Zhang Kexin1, Gao Tingting1, Fu Yuhui1, Li Jiening1, Wang Yuzhen1, Zhao Huiting2, Tian Xifeng3. Investigation on the intestinal parasite infection in 21 species of animals in the wildlife park in Tangshan city [J]. Journal of Tropical Diseases and Parasitology, 2017, 15(1): 28-30,21. |
| [15] | Ren Sumin, Tang Zhaowu.. Survey of intestinal nematode infections in Huai’an area from 2011 to 2015 [J]. Journal of Tropical Diseases and Parasitology, 2016, 14(4): 215-218. |
| Viewed | ||||||
|
Full text |
|
|||||
|
Abstract |
|
|||||